. 2010 Aug;104(2):627-40.
doi: 10.1152/jn.00169.2010. Epub 2010 May 19.

Temporal patterns of inputs to cerebellum necessary and sufficient for trace eyelid conditioning

Affiliations

Temporal patterns of inputs to cerebellum necessary and sufficient for trace eyelid conditioning

Brian E Kalmbach et al. J Neurophysiol. 2010 Aug.

Abstract

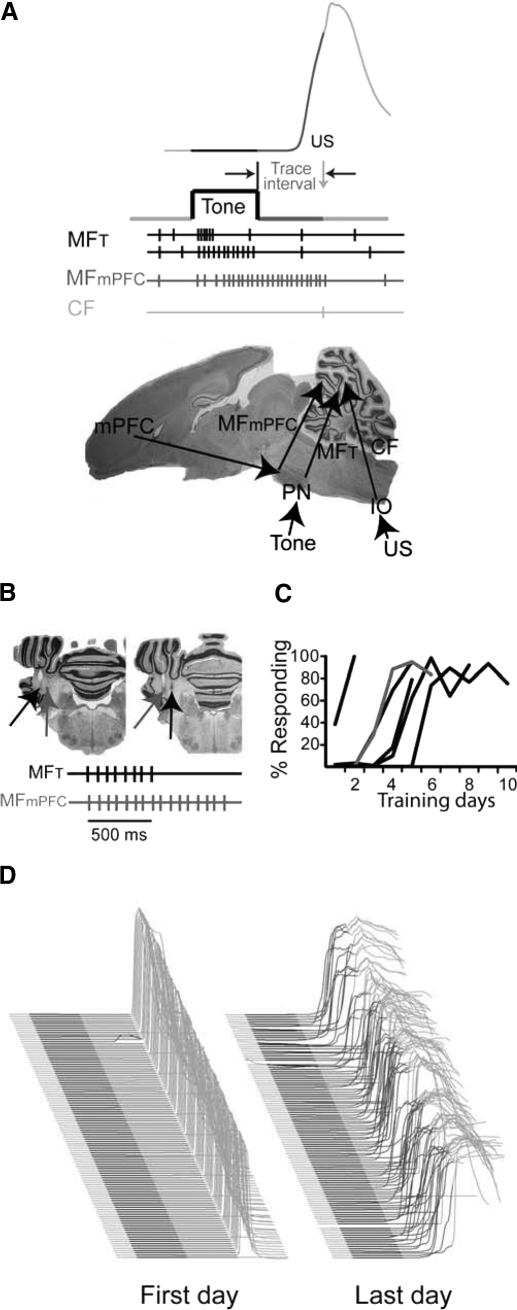
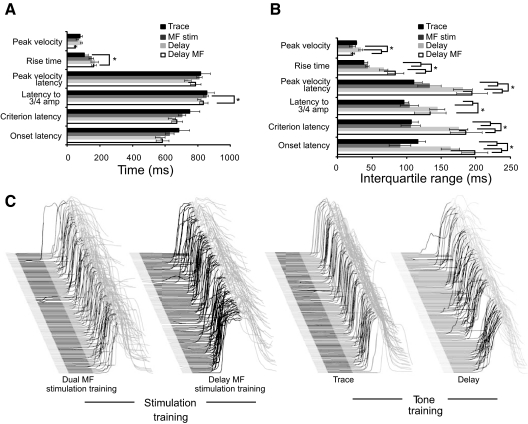
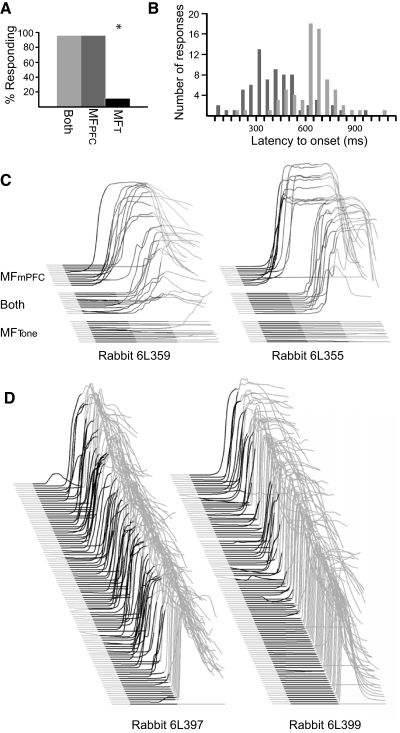
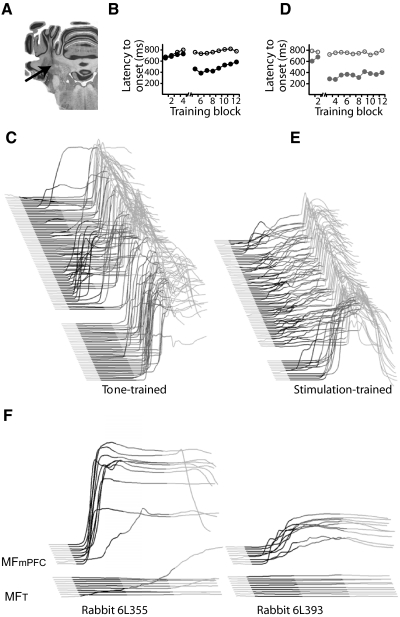
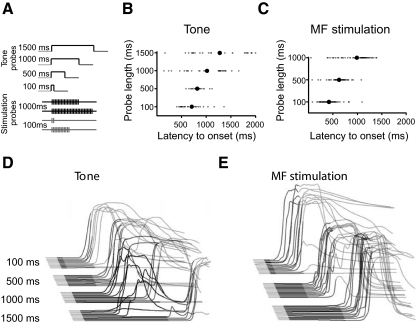
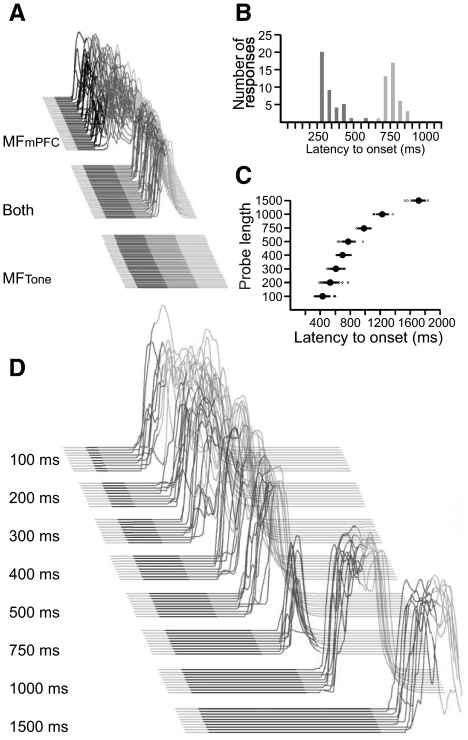
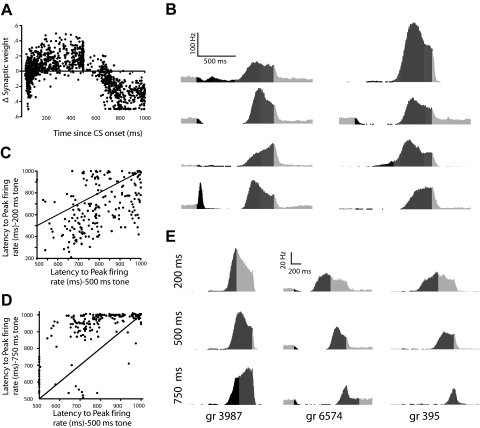
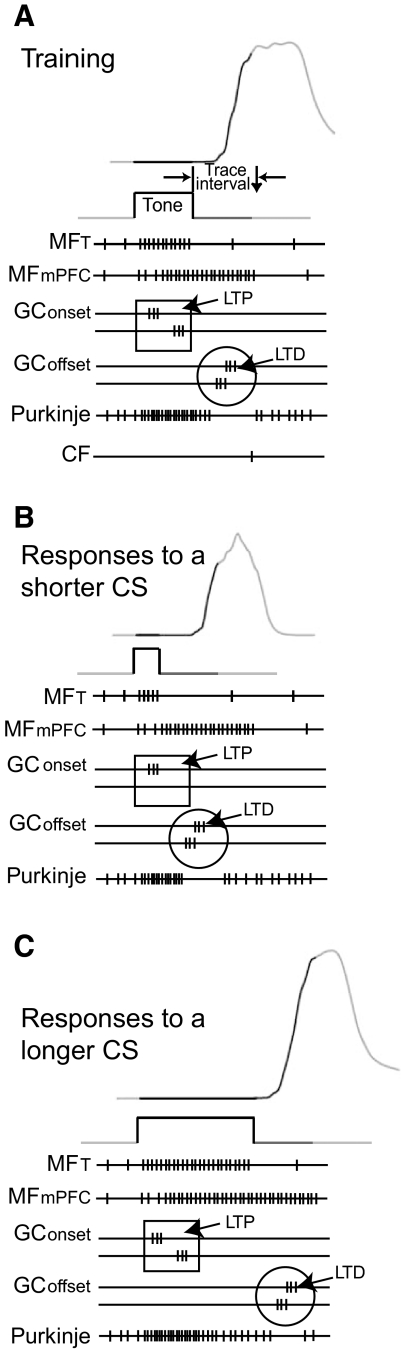
Trace eyelid conditioning is a form of associative learning that requires several forebrain structures and cerebellum. Previous work suggests that at least two conditioned stimulus (CS)-driven signals are available to the cerebellum via mossy fiber inputs during trace conditioning: one driven by and terminating with the tone and a second driven by medial prefrontal cortex (mPFC) that persists through the stimulus-free trace interval to overlap in time with the unconditioned stimulus (US). We used electric stimulation of mossy fibers to determine whether this pattern of dual inputs is necessary and sufficient for cerebellar learning to express normal trace eyelid responses. We find that presenting the cerebellum with one input that mimics persistent activity observed in mPFC and the lateral pontine nuclei during trace eyelid conditioning and another that mimics tone-elicited mossy fiber activity is sufficient to produce responses whose properties quantitatively match trace eyelid responses using a tone. Probe trials with each input delivered separately provide evidence that the cerebellum learns to respond to the mPFC-like input (that overlaps with the US) and learns to suppress responding to the tone-like input (that does not). This contributes to precisely timed responses and the well-documented influence of tone offset on the timing of trace responses. Computer simulations suggest that the underlying cerebellar mechanisms involve activation of different subsets of granule cells during the tone and during the stimulus-free trace interval. These results indicate that tone-driven and mPFC-like inputs are necessary and sufficient for the cerebellum to learn well-timed trace conditioned responses.


Figures

Fig. 1.
Fig. 1.
Stimulating mossy fibers to mimic medial prefrontal cortex (mPFC)-driven and tone-driven input supports learning. A: the procedures, neural pathways, and putative signals involved in trace eyelid conditioning. Top: trace eyelid conditioning involves the repeated presentation of a neutral stimulus, such as a tone, followed by a stimulus-free interval (trace interval) and a blink-evoking stimulus such as electrical stimulation around the eye [unconditioned stimulus (US)]. With repeated presentations, rabbits learn to close their eye in response to the tone. A sample sweep plotting eyelid position during a representative trial in a well-trained rabbit is shown at top. An upward deflection indicates eyelid closure, the black region marks the duration of the tone, and the dark gray region marks the trace interval. Responses during the light gray region are reflexive responses to the US. Middle: signals from cerebellar inputs during trace conditioning to a tone. Tones activate a subset of mossy fibers (MFT) that respond only to the beginning of the tone or others that respond for the duration of the tone. Other mossy fibers receive input from mPFC (MFmPFC) and putatively are activated at tone onset and respond persistently through the trace interval, consistent with the activity of mPFC neurons during trace eyelid conditioning. The US activates climbing fibers (CFs). Bottom: sagittal, whole brain section showing the pathways and structures involved in trace eyelid conditioning. PN, pontine nuclei; IO, inferior olive. B: stimulation protocol and electrode placements. Two electrodes were placed 1 mm lateral to each other in the middle cerebellar peduncle (2 sample placements are shown). One electrode was used to deliver stimulation to mimic how tones activate mossy fibers and the other to mimic mossy fibers putatively driven by persistent activity in mPFC. C: learning curves for 6 rabbits given mossy fiber stimulation during eyelid conditioning. The gray curve indicates the rabbit whose sample behavioral sweeps are shown in D. D: 108 trials from the first and last training days are stacked from first on bottom to last on top. The black region denotes the tone and the dark gray region denotes the trace interval. Responses during these intervals are learned.
Fig. 2.
Fig. 2.
A comparison of the timing of trace to tone, delay to tone, delay to mossy fiber stimulation, and dual mossy fiber stimulation conditioned responses shows that the dual stimulation responses quantitatively match normal trace conditioning. A: mean values of 6 timing parameters. The units for peak velocity are mm/s. B: trial-to-trial variability in 6 parameters of response timing. In most instances where trace conditioning and delay conditioning (tone and mossy fiber stimulation) using the same interstimulus interval (ISI) differ, the dual stimulation responses are significantly different from the delay responses (tone and mossy fiber stimulation) and not different from trace responses. C: sample eyelid sweeps from representative rabbits during their last day of training. *P < 0.05.
Fig. 3.
Fig. 3.
The cerebellum learns to respond to mPFC- but not tone-like mossy fiber input. A: rabbits responded to the mPFC-like input alone and to both inputs together but not tone-like input alone. B: a frequency histogram of latency to onset shows that responses to mPFC-like input alone (dark gray) had shorter latencies to onset than responses to both inputs (light gray). Data are grouped into 50 ms bins. C: behavioral responses to presentations of the mPFC-like input, the tone-like input, and both inputs from 2 representative rabbits. Responses to each trial type are sorted by latency to onset. Note that the latency to onset of responses to the mPFC-like input alone is shorter than that of responses to both inputs. D: stimulation using the electrode that previously delivered the tone-like input supports delay conditioning. Raw data from 2 rabbits are shown.
Fig. 4.
Fig. 4.
Deep cerebellar nucleus plasticity is established to mPFC-like input. A: coronal section of the cerebellum showing a representative infusion site. The cannula tip for all rabbits was in the interpositus nucleus of the cerebellum. B: infusing gabazine into the deep cerebellar nuclei (DCN) during test sessions (break in the abscissa) decreased the latency to onset of responses (●), whereas infusing artificial cerebrospinal fluid (ACSF) did not (○). C: sample behavioral sweeps from a tone-trained rabbit during a gabazine infusion session. Break in sweeps denotes infusion. D: infusing gabazine into the DCN during test sessions decreased the latency to onset of stimulation trained responses, whereas infusing ACSF did not. E: sample behavioral sweeps from a dual stimulation-trained rabbit during a gabazine infusion session. F: rabbits responded to mPFC-like input alone but not tone-like input alone during gabazine infusion sessions. Sweeps from 2 rabbits are shown.
Fig. 5.
Fig. 5.
The offset of the tone modulates response timing in trace eyelid conditioning. A: diagram of probe trials. B: the timing of tone trained responses depended on the length of the tone. Large filled circles represent the mean latency to onset of responses across rabbits for a given trial type. Small circles are individual data points from individual trials. C: the timing of stimulation-trained responses depends on the length of the tone-like input. D: sample behavioral sweeps from a representative rabbit in response to each probe trial. Responses for a given trial are sorted by latency to onset. E: sample behavioral sweeps from a representative stimulation-trained rabbit in response to each probe trial. Responses are sorted as in D.
Fig. 6.
Fig. 6.
The output of computer simulations of the cerebellum in response to tone- and mPFC-like mossy fiber input. All data in this figure are from simulations trained with a 500 ms mossy fiber input to mimic a 500 ms tone and a 1,000 ms input to mimic input driven by mPFC. A: a well-trained simulation responds to mPFC- but not tone-like input presented alone. B: responses to mPFC-like input alone (dark gray) have a shorter latency to onset than responses to both inputs (light gray). C: the offset of the tone-like input affected the timing of responses. D: responses of the simulation during probe trials where the length of the tone-like input was varied.
Fig. 7.
Fig. 7.
The cerebellum generates granule cell activity driven by the offset of the tone-like input and uses this to time its output. A: the strength of granule cell-to-Purkinje cell synapses active early during the trial increases and those active late during the trial decrease. Plotted is the latency to peak activity vs. change in synaptic weight as the result of training for individual granule cells. B: sample peristimulus histograms of granule cells whose peak activity occurred during the trace interval. The light gray region marks the 200 ms before the onset of the trial and 500 ms after US offset, black marks the duration of the tone, and dark gray marks the trace interval. C: the activity of a subset of granule cells peaked earlier during a 200 ms probe than during a 500 ms probe. Plotted is the latency to peak activity of individual granule cells during the 500 ms trial vs. the 200 ms trial. Data points below the unity line represent granule cells whose peak activity occurred earlier during the 200 ms probe than during the 500 ms probe. D: the activity of a subset of granule cells peaked later during a 750 ms probe than during a 500 ms probe. Plotted is the latency to peak activity of individual granule cells during the 500 ms trial vs. the 750 ms trial. Data points above the unity line represent granule cells whose peak activity occurred later during the 750 ms probe than during the 500 ms probe. E: sample histograms of granule cells whose activity peaked during the trace interval and varied with the length of the tone input.
Fig. 8.
Fig. 8.
Schematic illustration of potential cerebellar mechanisms of response timing during trace eyelid conditioning. A: during trace eyelid conditioning, tone-driven and mPFC-driven mossy fiber input generates 2 general classes of granule cell activity. The peak activity of some granule cells is tied to the onset of the conditions stimulus (CS) (GConset) and the peak activity of others is tied to the offset of the CS (GCoffset). Granule cell-to-Purkinje cell synapses active early during a trial tend to increase in strength (long-term potentiation) and those active late during the trial tend to decrease in strength (long-term depression). When strengthened synapses are active, Purkinje cell activity tends to increase, and when weakened synapses are active, Purkinje cell activity tends to decrease. Because Purkinje cells are the sole output of the cerebellar cortex and inhibit the output of the cerebellum, early during the trial, when strengthened synapses are active, responding is suppressed, whereas late during the trial, when weakened synapses are active, responding is initiated. B: the peak activity of granule cells driven by the onset of the CS does not vary during the presentation of a CS shorter than the one used during training. However, the peak activity of granule cell-to Purkinje cell synapses driven by the offset of the CS occurs earlier. Because these synapses were weakened by training, their activation results in a response that is initiated shortly after CS offset. C: the peak activity of granule cells driven by the onset of the CS does not vary during the presentation of a CS longer than the one used during training. However, the peak activity of granule cells driven by the offset of the CS occurs later, resulting in a response that is initiated shortly after CS offset.

Similar articles

Cited by

References

    1. Aitkin LM, Boyd J. Acoustic input to the lateral pontine nuclei. Hear Res 1: 67–77, 1978 - PubMed
    1. Bao S, Chen L, Kim JJ, Thompson RF. Cerebellar cortical inhibition and classical eyeblink conditioning. Proc Natl Acad Sci USA 99: 1592–1597, 2002 - PMC - PubMed
    1. Blum S, Hebert AE, Dash PK. A role for the prefrontal cortex in recall of recent and remote memories. Neuroreport 17: 341–344, 2006 - PubMed
    1. Boyd J, Aitkin LM. Responses of single units in the pontine nuclei of the cat to acoustic stimulation. Neurosci Lett 3: 259–263, 1976 - PubMed
    1. Bracha V, Zbarska S, Parker K, Carrel A, Zenitsky G, Bloedel JR. The cerebellum and eye-blink conditioning: learning versus network performance hypotheses. Neuroscience 162: 787–796, 2009 - PMC - PubMed

Publication types

MeSH terms

LinkOut - more resources