

Review
doi: 10.1167/iovs.10-5176.
The mouse retina as an angiogenesis model
Affiliations
- PMID: 20484600
- PMCID: PMC2891451
- DOI: 10.1167/iovs.10-5176
Item in Clipboard
Review
The mouse retina as an angiogenesis model
Invest Ophthalmol Vis Sci.
2010 Jun.
Abstract
The mouse retina has been used extensively over the past decades to study both physiologic and pathologic angiogenesis. Over time, various mouse retina models have evolved into well-characterized and robust tools for in vivo angiogenesis research. This article is a review of the angiogenic development of the mouse retina and a discussion of some of the most widely used vascular disease models. From the multitude of studies performed in the mouse retina, a selection of representative works is discussed in more detail regarding their role in advancing the understanding of both the ocular and general mechanisms of angiogenesis.
Figures
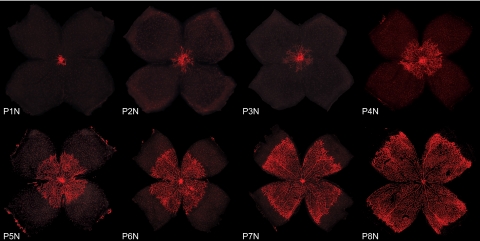
Development of the superficial vascular plexus in C57Bl/6 mouse retinas. Retinal whole mounts from postnatal day (P)1 to P8 were stained for endothelial cells with isolectin B4-Alexa 594 (red). N (normoxia) signifies normal development, as opposed to the hyperoxia time course shown in Figures 4 and 5. At P1N, the mouse retina is almost completely devoid of blood vessels. The superficial vascular plexus can be seen originating from the optic nerve head. During the first week of postnatal development, the superficial plexus extends radially from the optic nerve head into the surrounding tissue, reaching the retinal periphery at ∼P8N.

Development of the deep and intermediate vascular plexus in C57Bl/6 mouse retinas. Retinal whole mounts and cross sections from postnatal day (P)9 to P25 were stained for endothelial cells with isolectin B4-Alexa 594 (red) and for cell nuclei with DAPI (blue). N (normoxia) signifies normal development, as opposed to the hyperoxia time course shown in Figures 4 and 5. (a) At P9N, the superficial plexus has fully extended to the peripheral retina. The deep vascular plexus begins forming centrally from vertical vessels diving down from the superficial plexus. The intermediate vascular plexus has not begun to form yet. On cross section, the three neuronal layers of the retina and the superficial vascular plexus can be identified. Representative drawings on the right illustrate both superficial and deep vascular plexus in the immediate vicinity of the optic nerve, whereas in the periphery the superficial plexus remains the only vascular network. (b) At P12N, the intermediate vascular plexus becomes visible on retinal whole mounts. The deep vascular plexus is nearly fully developed. On cross section, vertical sprouting of vessels toward the intermediate plexus can be observed. Representative drawings illustrate the beginning of a three-layered vascular plexus around the optic nerve and superficial and deep vascular plexus with interconnecting vessels in the periphery. (c) At P15N, the intermediate vascular plexus continues to develop throughout the retina as illustrated both on retinal whole mounts and cross sections. Representative drawings illustrate complete formation of superficial and deep plexus with continued development of the intermediate vascular plexus in the periphery. (d) At P17N, the superficial, intermediate, and deep plexus can be seen both centrally and in the peripheral retina. Cross sections and representative drawings illustrate the three-layered vascular system in all parts of the retina along with multiple interconnecting vessels. (e, f) Between P21N and P25N, further maturation of especially the intermediate plexus can be observed. Cross sections and representative drawings illustrate the mature retinal vasculature. Note that isolectin B4 binds to choroidal vessels as well as nonspecifically to RPE and the scleral wall in some of the cross sections (a–f).
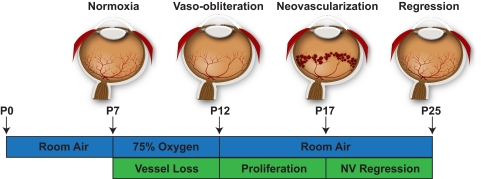
The mouse model of OIR. Neonatal mice and their nursing mother are kept at room air from birth through postnatal day (P)7. From P7 to P12, the mice are exposed to 75% oxygen, which induces loss of immature retinal vessels and slows development of the normal retinal vasculature, leading to a central zone of vaso-obliteration (VO). After returning mice to room air at P12, the central avascular retina becomes hypoxic, triggering both normal vessel regrowth and a pathologic formation of extraretinal neovascularization (NV). Maximum severity of NV is reached at P17. Shortly thereafter, NV starts to regress and by P25 almost no VO or NV remains visible. This figure was first published in Connor KM, Krah NM, Dennison RJ, et al. Quantification of oxygen-induced retinopathy in the mouse: a model of vessel loss, vessel regrowth and pathologic angiogenesis. Nat Protoc. 2009;4:1565–1573.
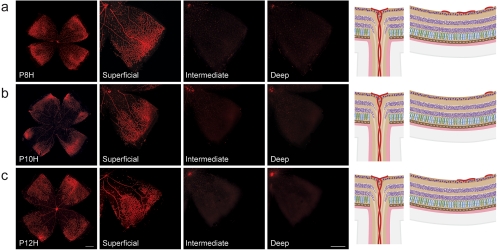
Vessel loss during hyperoxia in the OIR model. Retinal whole mounts from postnatal day (P)8 to P12 were stained for endothelial cells with isolectin B4-Alexa 594 (red). H for hyperoxia is used to signify the OIR time course as opposed to the normal development shown in Figures 1 and 2. (a) At P8H, only 24 hours after onset of hyperoxia, a central zone of vaso-obliteration (VO) develops in the superficial vascular plexus. As hyperoxia coincides with formation of the intermediate and deep vascular plexus, development of these layers is significantly impeded. Right: representative drawings of the central VO zone showing preserved superficial vessels in the periphery and the absence of deep and intermediate vessel formation. (b) At P10H, the central VO zone has increased in size, extending farther into the peripheral retina. Formation of both deep and intermediate plexus is suppressed. (c) At P12H, the central VO zone has slightly decreased in size, probably due to revascularization in response to increased oxygen demand of the developing retina. The deep and intermediate plexus, however, are still absent.
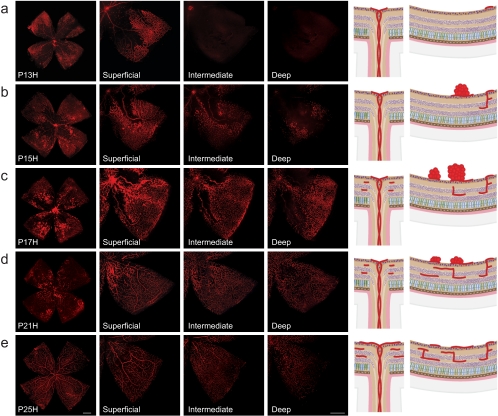
Neovascularization during relative hypoxia in the OIR model. Retinal whole mounts from postnatal day (P)13 to P25 were stained for endothelial cells with isolectin B4-Alexa 594 (red). H for hyperoxia is used to signify OIR time course as opposed to the normal development shown in Figures 1 and 2. (a) At P13H, 24 hours after moving mice back to room air, the superficial vascular plexus shows a central area of vaso-obliteration (VO) without morphologic signs of neovascularization (NV). Intermediate and deep vascular plexus are absent. (b) At P15H, the VO zone has decreased in size through revascularization by normal vessels. At the same time, NV formation in the superficial vascular plexus starts to emerge between the VO zone and the peripheral vascularized retina. Vertical vessels diving down to form the deep and intermediate plexus can be observed in the peripheral retina where the superficial plexus was preserved during hyperoxia. Both this growth pattern and the time course of deeper plexus formation differ significantly from normal development. Representative drawings on the right illustrate vessel regrowth and extraretinal NV formation in the superficial plexus along with development of the deep and intermediate plexus. (c) At P17H, revascularization of the VO zone has progressed farther and pathologic NV formation is at its maximum. The intermediate and deep vascular plexus have continued to form, covering now the same area as the superficial plexus. The remaining central VO zone is devoid of all three vascular layers. (d) At P21H, revascularization of the VO area has progressed farther in all layers and NV has begun to regress. (e) At P25H, the VO area is fully revascularized in all layers and NV has completely resolved.
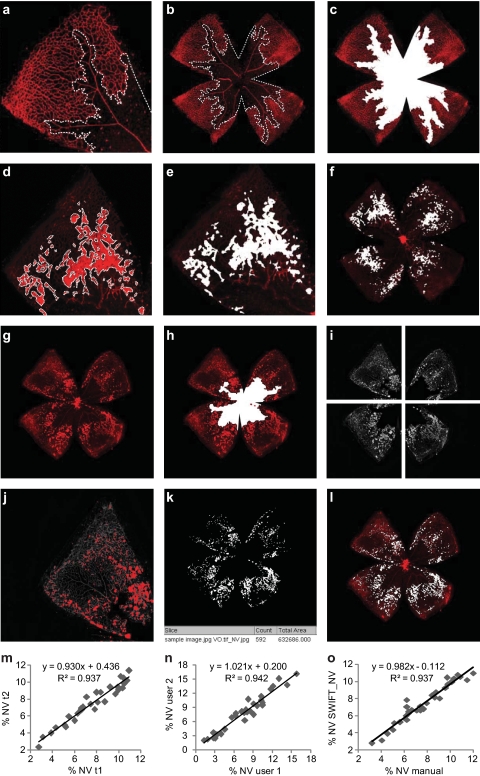
Quantification of vaso-obliteration (VO) and neovascularization (NV) in the OIR mouse model. Retinal whole-mounts from postnatal day (P)17 were stained for endothelial cells with isolectin B4-Alexa 594 (red), with VO and NV outlined in white. (a–c) For measurement of VO, the central avascular area was outlined with image-processing software (Photoshop; Adobe Systems, San Jose, CA) in relation to total retinal area (%VO). (d–f) For manual quantification of neovascularization, each individual neovascularization tuft and cluster was outlined using image-processing software (Photoshop; Adobe Systems) and the total neovascular area is expressed in relation to total retinal area (%NV). (g, h) For computer-aided NV quantification, both the original image and the VO image were imported into NIH's free-access ImageJ software (developed by Wayne Rasband, National Institutes of Health, Bethesda, MD; available at http://rsb.info.nih.gov/ij/index.html ). (i) The macro set SWIFT_NV divides the VO image into four quadrants, isolates the red color channel, and subtracts background fluorescence. (j) SWIFT_NV then allows the user to set a fluorescence threshold for each quadrant, marking NV tufts but not normal vessels. (k, l) Using the user-defined thresholds, SWIFT_NV quantifies all NV pixels from all four quadrants, reports the result as neovascular total area and creates an overlay of NV and original image. (m–o) Results obtained with the SWIFT_NV macros show reliable intra- and interindividual reproducibility and very good correlations to the established hand measurement protocols. Parts (a) through (f) of this figure were first published in Connor KM, Krah NM, Dennison RJ, et al. Quantification of oxygen-induced retinopathy in the mouse: a model of vessel loss, vessel regrowth and pathologic angiogenesis. Nat Protoc. 2009;4:1565–1573; parts (g) through (o) were reproduced with permission from Stahl A, Connor KM, Sapieha P, et al. Computer-aided quantification of retinal neovascularization. Angiogenesis. 2009;12:297–301. © Springer.
References
-
- Kennedy D. Breakthrough of the year. Science 2006;314:1841. - PubMed
-
- Kempen JH, O'Colmain BJ, Leske MC, et al. The prevalence of diabetic retinopathy among adults in the United States. Arch Ophthalmol 2004;122:552–563 - PubMed
-
- Klein BE. Overview of epidemiologic studies of diabetic retinopathy. Ophthalmic Epidemiol 2007;14:179–183 - PubMed
-
- Congdon N, O'Colmain B, Klaver CC, et al. Causes and prevalence of visual impairment among adults in the United States. Arch Ophthalmol 2004;122:477–485 - PubMed
-
- Friedman DS, O'Colmain BJ, Munoz B, et al. Prevalence of age-related macular degeneration in the United States. Arch Ophthalmol 2004;122:564–572 - PubMed
Publication types
MeSH terms
Grants and funding
LinkOut - more resources
Full Text Sources
Other Literature Sources
Miscellaneous
