. 2010 Jun 8;107(23):10371-6.
doi: 10.1073/pnas.0909374107. Epub 2010 May 19.

Prediction and validation of cell alignment along microvessels as order principle to restore tissue architecture in liver regeneration

Affiliations

Prediction and validation of cell alignment along microvessels as order principle to restore tissue architecture in liver regeneration

Stefan Hoehme et al. Proc Natl Acad Sci U S A. .

Abstract

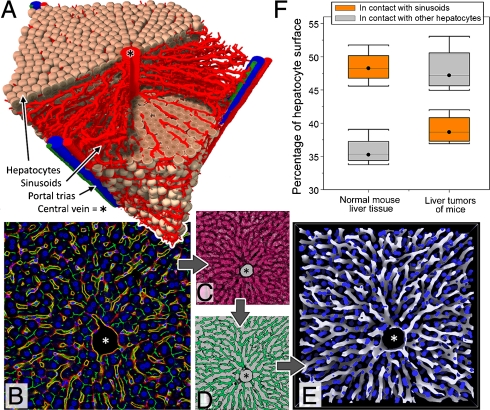
Only little is known about how cells coordinately behave to establish functional tissue structure and restore microarchitecture during regeneration. Research in this field is hampered by a lack of techniques that allow quantification of tissue architecture and its development. To bridge this gap, we have established a procedure based on confocal laser scans, image processing, and three-dimensional tissue reconstruction, as well as quantitative mathematical modeling. As a proof of principle, we reconstructed and modeled liver regeneration in mice after damage by CCl(4), a prototypical inducer of pericentral liver damage. We have chosen the regenerating liver as an example because of the tight link between liver architecture and function: the complex microarchitecture formed by hepatocytes and microvessels, i.e. sinusoids, ensures optimal exchange of metabolites between blood and hepatocytes. Our model captures all hepatocytes and sinusoids of a liver lobule during a 16 days regeneration process. The model unambiguously predicted a so-far unrecognized mechanism as essential for liver regeneration, whereby daughter hepatocytes align along the orientation of the closest sinusoid, a process which we named "hepatocyte-sinusoid alignment" (HSA). The simulated tissue architecture was only in agreement with the experimentally obtained data when HSA was included into the model and, moreover, no other likely mechanism could replace it. In order to experimentally validate the model of prediction of HSA, we analyzed the three-dimensional orientation of daughter hepatocytes in relation to the sinusoids. The results of this analysis clearly confirmed the model prediction. We believe our procedure is widely applicable in the systems biology of tissues.


Conflict of interest statement

The authors declare no conflict of interest.

Figures

Fig. 1.
Fig. 1.
(A) Concrete liver lobule inferred from experimental data by the image processing chain shown in (B)–(E) and successive image analysis. Reconstructed lobules served as an initial state for the mathematical model. (B) A typical image obtained by confocal microscopy after adaptive histogram equalization filtering. Blue: DAPI (hepatocyte nuclei); yellow: ICAM + DPPIV (sinusoids); red: ICAM; green: DPPIV. (C) Effect of generalized erosion filtering (all red pixels will be removed). (D) Effect of generalized dilatation filtering (all green pixels are added). (E) Result of image processing chain in three dimensions. Blue: Hepatocyte nuclei; white: sinusoids. Note the complex architecture that links the periportal zone with the central vein in the middle of the lobule. (F) Fraction of the surface area of hepatocytes in contact with sinusoids (orange) and other hepatocytes (gray) in normal liver tissue and liver carcinomas. Details in SI Appendix.
Fig. 2.
Fig. 2.
Representative examples of mouse liver lobules visualized under light microscopy. (A) Control, (B) 2 d, (C) 4 d, and (D) 8 d after administration of CCl4, illustrating the emergence and regeneration of the central dead cell area. The examples shown in (A)–(D), employing a suboptimal peroxidase block, allowed an automated differentiation between the paler central dead cell area (B2, green striped area) and the darker surviving hepatocytes, while, at larger magnification, BrdU-positive and BrdU-negative cells could still be clearly distinguished. Hand-drawn lines in (A)–(D), (A2) and (B2) show the approximate extension of the liver lobules. (A2) Central veins were identified by immunostaining for GS. The process parameters for quantification of the regeneration process were (E) distribution of BrdU-positive cells in a liver lobule. Three mice were used per time point, namely, 0, 1, 2, 3, 4, 8, and 16 d after administration of CCl4. At least two liver lobules were analyzed per mouse: (F) average hepatocyte density, (G) area of central necrosis, and (H) hepatocyte-sinusoid contact area over time.
Fig. 3.
Fig. 3.
Regeneration in the simulation model, starting with a representative liver lobule. (A)–(C) partly show cross sections (compared to Fig. 1A) of model simulations: (A) simulation result from model 1 after 10 d, (B) simulation result from model 2 after 10 d, and (C) illustration of the regeneration process (after t = 0, 1, 2, 4, and 10 d) using model 3 (Movies S1S3). (D)–(F) A quantitative comparison of experimental data with each model: (D) average hepatocyte density, (E) area of central necrosis, and (F) hepatocyte-sinusoid contact area.
Fig. 4.
Fig. 4.
Sinusoidal cells survive in the central dead cell area of the liver lobule after CCl4 poisoning and activate the tie-2 promoter. (A) Constructs of the triple transgenic tie-2-reporter mice. (B) Liver tissue of an untreated tie-2-reporter mouse. Green fluorescence (EGFP) indicates positive tie-2 promoter activity in the endothelial cells of a vein (white arrow in upper right image). Sinusoidal cells are visualized by CD31 immunostaining (light red in the lower left image) and nuclei by DAPI (blue in the lower right image). The merged picture (upper left image) demonstrates that endothelial cells of the vein, but not the sinusoidal cells, express EGFP (yellow). (C) and (D) Two days after CCl4 administration, some of the sinusoidal cells start to express EGFP. (C) EGFP green fluorescence and (D) green, red, and blue merged fluorescence. The central dead cell area is characterized by loss of nuclei and increased red background fluorescence. A substantial fraction of the sinusoidal cells within the central dead hepatocyte area survives and starts to express EGFP as a reporter of tie-2-promoter activity. 3D reconstructed lobule (E) before and (F) after CCl4 administration. As hepatocytes (blue) die, the sinusoids (gray) remain largely intact.
Fig. 5.
Fig. 5.
Experimental validation of HSA. (A) Immunohistochemistry staining in light microscopy. BrdU-positive nuclei are dark brown. (B) Confocal microscopy image, green: BrdU-positive cells; blue: nonproliferating hepatocytes; red: lectin (cell boundaries; sinusoids). Note the pair of BrdU-positive cells indicated by the white arrow is oriented in parallel to the neighboring sinusoid indicated by a yellow arrow. (C) 3D reconstruction of two daughter cells that are oriented in the direction of the neighboring sinusoid. (D) 3D distribution of BrdU-positive cells and sinusoids. The inset shows the connecting line of daughter hepatocytes (red) and their orientation (angle α) with regard to the closest sinusoid (blue line). (E) Density-distribution for α in experiments and models 1–3.

Comment in

Similar articles

Cited by

References

    1. Michalopoulos GK, DeFrances M. Liver regeneration. Science. 1997;276:60–66. - PubMed
    1. Juskeviciute E, Vadigepalli R, Hoek JB. Temporal and functional profile of the transcriptional regulatory network in the early regenerative response to partial hepatectomy in the rat. BMC Genomics. 2008;9:527–541. - PMC - PubMed
    1. Gómez MID, et al. Liver nuclear and microsomal cyp2e1-mediated metabolism of xenobiotics in rats chronically drinking an alcohol-containing liquid diet. Toxicol Ind Health. 2006;22:367–374. - PubMed
    1. Hoehme S, et al. Mathematical modelling of liver regeneration after intoxication with ccl4. Chem Biol Interact. 2007;168:74–93. - PubMed
    1. Chu YS, et al. Johnson-Kendall-Roberts theory applied to living cells. Phys Rev Lett. 2005;94:028102. - PubMed

Publication types