

Predicting the efficacy of radiotherapy in individual glioblastoma patients in vivo: a mathematical modeling approach
- PMID: 20484781
- PMCID: PMC3786554
- DOI: 10.1088/0031-9155/55/12/001
Predicting the efficacy of radiotherapy in individual glioblastoma patients in vivo: a mathematical modeling approach
Abstract
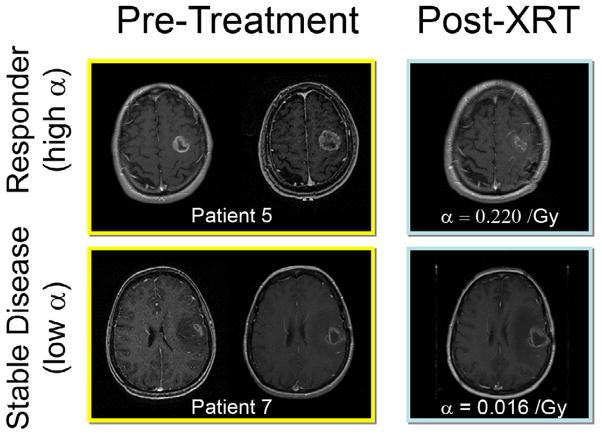
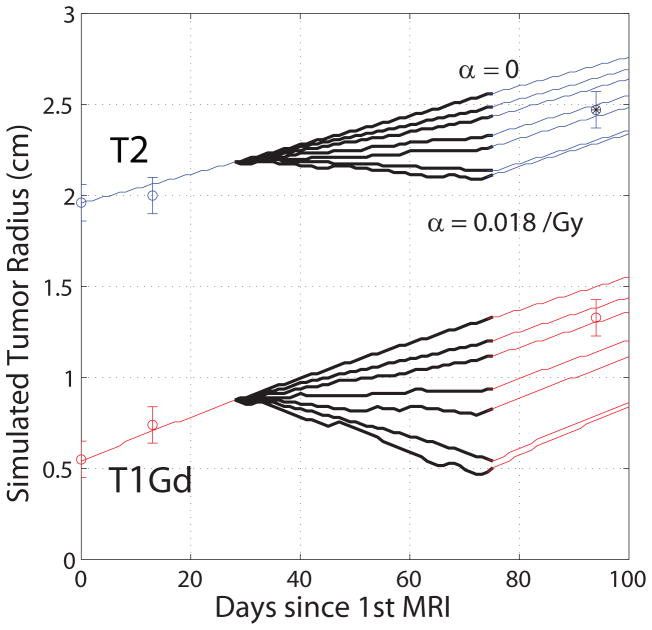
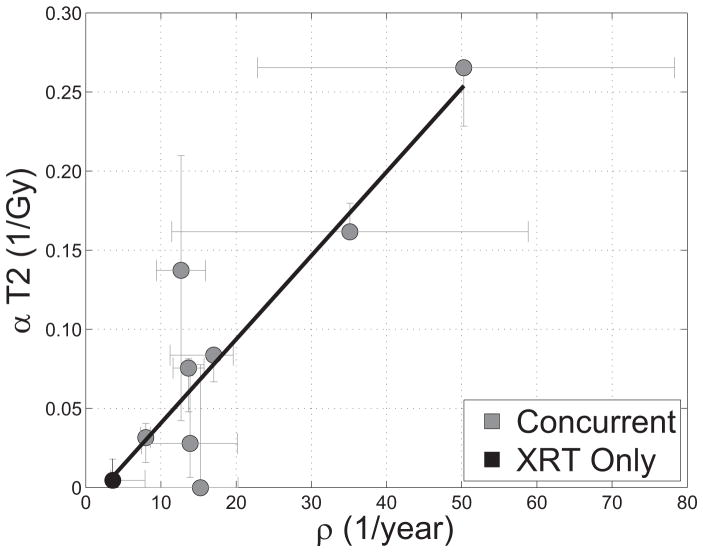
Glioblastoma multiforme (GBM) is the most malignant form of primary brain tumors known as gliomas. They proliferate and invade extensively and yield short life expectancies despite aggressive treatment. Response to treatment is usually measured in terms of the survival of groups of patients treated similarly, but this statistical approach misses the subgroups that may have responded to or may have been injured by treatment. Such statistics offer scant reassurance to individual patients who have suffered through these treatments. Furthermore, current imaging-based treatment response metrics in individual patients ignore patient-specific differences in tumor growth kinetics, which have been shown to vary widely across patients even within the same histological diagnosis and, unfortunately, these metrics have shown only minimal success in predicting patient outcome. We consider nine newly diagnosed GBM patients receiving diagnostic biopsy followed by standard-of-care external beam radiation therapy (XRT). We present and apply a patient-specific, biologically based mathematical model for glioma growth that quantifies response to XRT in individual patients in vivo. The mathematical model uses net rates of proliferation and migration of malignant tumor cells to characterize the tumor's growth and invasion along with the linear-quadratic model for the response to radiation therapy. Using only routinely available pre-treatment MRIs to inform the patient-specific bio-mathematical model simulations, we find that radiation response in these patients, quantified by both clinical and model-generated measures, could have been predicted prior to treatment with high accuracy. Specifically, we find that the net proliferation rate is correlated with the radiation response parameter (r = 0.89, p = 0.0007), resulting in a predictive relationship that is tested with a leave-one-out cross-validation technique. This relationship predicts the tumor size post-therapy to within inter-observer tumor volume uncertainty. The results of this study suggest that a mathematical model can create a virtual in silico tumor with the same growth kinetics as a particular patient and can not only predict treatment response in individual patients in vivo but also provide a basis for evaluation of response in each patient to any given therapy.
Figures
Comment in
-
Comment on 'Predicting the efficacy of radiotherapy in individual glioblastoma patients in vivo: a mathematical modeling approach'.Phys Med Biol. 2016 Apr 7;61(7):2967. doi: 10.1088/0031-9155/61/7/2967. Epub 2016 Mar 17. Phys Med Biol. 2016. PMID: 26988563 No abstract available.
-
Reply to comment on: 'Predicting the efficacy of radiotherapy in individual glioblastoma patients in vivo: a mathematical modeling approach'.Phys Med Biol. 2016 Apr 7;61(7):2968-9. doi: 10.1088/0031-9155/61/7/2968. Epub 2016 Mar 17. Phys Med Biol. 2016. PMID: 26988701 No abstract available.
References
-
- Alvord EC, Jr, Shaw CM. In: The pathology of the aging human nervous system. Ducket S, editor. Philadelphia: Lea & Febiger; 1991. pp. 210–81.
-
- Bauman GS, Fisher BJ, McDonald W, Amberger VR, Moore E, Del Maestro RF. Effects of radiation on a three-dimensional model of malignant glioma invasion. Int J Dev Neurosci. 1999a;17:643–51. - PubMed
-
- Bauman GS, MacDonald W, Moore E, Ramsey DA, Fisher BJ, Amberger VR, Del Maestro RM. Effects of radiation on a model of malignant glioma invasion. J Neurooncol. 1999b;44:223–31. - PubMed
-
- Cunningh JR, Niederer J. Mathematical-Model for Cellular Response to Radiation. Phys Med Bio. 1972;17:685.
-
- de Wit MC, de Bruin HG, Eijkenboom W, Sillevis Smitt PA, van den Bent MJ. Immediate post-radiotherapy changes in malignant glioma can mimic tumor progression. Neurology. 2004;63:535–7. - PubMed
Publication types
MeSH terms
Grants and funding
LinkOut - more resources
Full Text Sources
Other Literature Sources