. 2010 Jun;120(6):2005-15.
doi: 10.1172/JCI41250. Epub 2010 May 17.

PET probes for distinct metabolic pathways have different cell specificities during immune responses in mice

Affiliations

PET probes for distinct metabolic pathways have different cell specificities during immune responses in mice

Evan Nair-Gill et al. J Clin Invest. 2010 Jun.

Erratum in

  • J Clin Invest. 2010 Jul 1;120(7):2641

Abstract

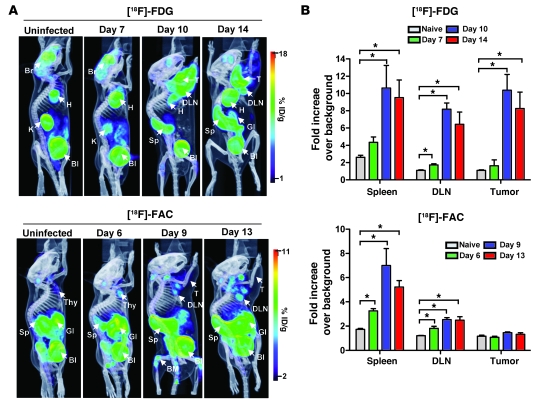
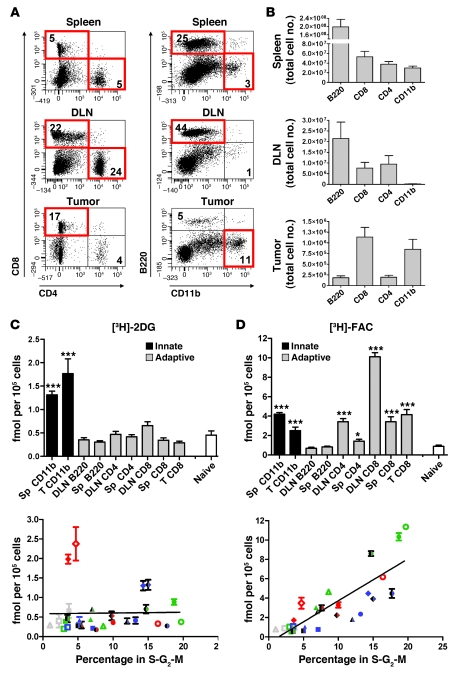
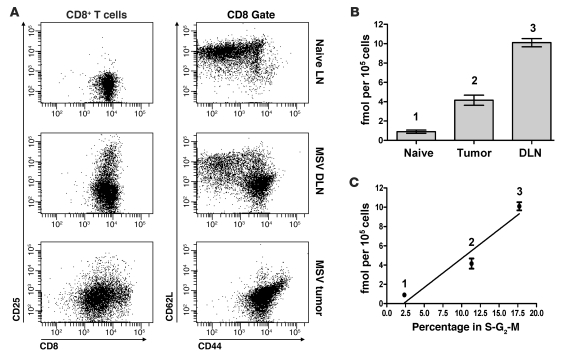
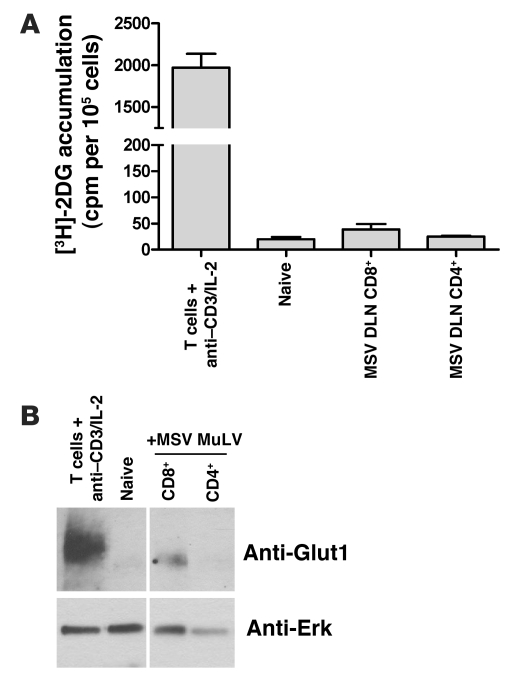
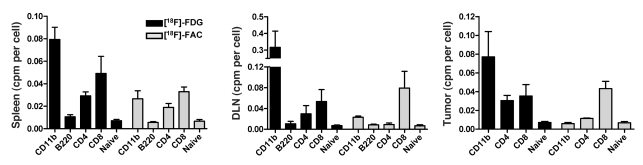
Clinical tools that measure changes in immune cell metabolism would improve the diagnosis and treatment of immune dysfunction. PET, utilizing probes for specific metabolic processes, detects regions of immune activation in vivo. In this study we investigated the immune cell specificity of PET probes for two different metabolic pathways: [18F]-2-fluorodeoxyglucose ([18F]-FDG) for glycolysis and [18F]-2-fluoro-D-(arabinofuranosyl)cytosine ([18F]-FAC) for deoxycytidine salvage. We isolated innate and adaptive immune cells from tissues of mice challenged with a retrovirus-induced sarcoma and measured their ability to accumulate FDG and FAC. We determined that the two probes had distinct patterns of accumulation: FDG accumulated to the highest levels in innate immune cells, while FAC accumulated predominantly in CD8+ T cells in a manner that correlated with cellular proliferation. This study demonstrates that innate and adaptive cell types differ in glycolytic and deoxycytidine salvage demands during an immune response and that these differential metabolic requirements can be detected with specific PET probes. Our findings have implications for the interpretation of clinical PET scans that use [18F]-FDG or [18F]-FAC to assess immune function in vivo and suggest potential applications of metabolic PET to monitor the effects of targeted immune modulation.


Figures

Figure 1
Figure 1. Metabolic PET imaging with [18F]-FDG and [18F]-FAC detects multiple sites of immune activation during a primary antitumor response.
(A) Immunocompetent C57BL/6 mice were injected intramuscularly with the MSV/MuLV retroviral complex and imaged with [18F]-FDG on days 7, 10, and 14 and [18F]-FAC on days 6, 9, and 13 after inoculation. [18F]-FDG and [18F]-FAC PET images of unchallenged C57BL/6 mice are shown as controls (n = 3 for each group). Br, brain; H, heart; K, kidney; Bl, bladder; T, tumor; Sp, spleen; GI, gastrointestinal tract; Thy, thymus; %ID/g, percent injected dose per gram. (B) Quantification of PET signal in the spleen, DLN, and tumor (*P < 0.05).
Figure 2
Figure 2. Inoculation with MSV/MuLV leads to increased density of diverse immune cell types in lymphoid organs and transformed muscle tissue.
(A) Tumor, DLN, and spleens were harvested from MSV/MuLV-infected mice 14 days after inoculation, at the peak of the antitumor response, sectioned, and stained with antibodies for CD4, CD8, B220, and CD11b (original magnification: ×20; insets, ×40). Corresponding tissue from uninfected mice were stained for comparison. (B) Quantification of the density of positively stained cells in tissues from naive and MSV/MuLV-infected mice (3 sections for each stain). (C) Whole-body coronal sections for autoradiographic validation of [18F]-FDG and [18F]-FAC accumulation in tissues during MSV/MuLV infection (asterisk indicates saturated region on detector). Mu/T, muscle/tumor; Li, liver.
Figure 3
Figure 3. Cell-intrinsic [3H]-2DG accumulation is highest in innate immune cells, while [3H]-FAC accumulates predominantly in adaptive immune cells.
(A) Single-cell suspensions of spleen, DLN, and tumor from MSV/MuLV-infected mice were analyzed for CD4, CD8, B220, and CD11b by flow cytometry. Populations that were collected for probe accumulation analysis are boxed in red. Values in the quadrants represent the percentage of major immune lineages isolated from each tissue. (B) The total number of each cell type recovered from the spleen, DLN, and tumor are shown (n = 6 mice). (C and D) Cells (105) from the sorted populations were pulse labeled with [3H]-2DG (C) or [3H]-FAC (D) and compared with naive lymphocytes (***P < 0.0001, *P < 0.05, n = 3 experiments). Sorted cells were fixed and stained with propidium iodide. The percentage in S-G2-M was plotted against the accumulation of [3H]-2DG and [3H]-FAC. Data from 3 experiments are shown. Open, filled, and half-filled symbols represent 3 experiments. Shapes were assigned according to cell type: squares, B cells; triangles, CD4+ T cells; circles, CD8+ T cells; diamonds, CD11bhi myeloid cells. Colors were assigned based on the tissues from which a cell population was isolated: blue, spleen; green, DLN; red, tumor; gray, naive lymph nodes. A positive correlation between [3H]-FAC accumulation and percent in S-G2-M was observed (r2 = 0.68, P < 0.0001).
Figure 4
Figure 4. Cytotoxic T cell populations with different activation phenotypes vary in their capacity to accumulate FAC.
(A) Analysis of the activation status of CD8+ T cells sorted from the tumor and DLNs based on surface expression of CD25, CD44, and CD62L. CD8+ T cells from unchallenged animals are shown as controls (naive). (B) [3H]-FAC accumulation in CD8+ T cells isolated from the tumor and DLNs of MSV/MuLV-infected mice and from the lymph nodes of naive mice (same cell populations as in Figure 2B). (C) [3H]-FAC accumulation in CD8+ T cells from different anatomical sites plotted against the average percentage of those cells in S-G2-M of the cell cycle from 3 independent experiments.
Figure 5
Figure 5. [3H]-2DG accumulation and Glut1 expression in T cell populations activated in vivo are lower than in T cells stimulated with anti-CD3 and IL-2.
(A) T cells stimulated in vitro with anti-CD3 and IL-2 were compared with CD8+ and CD4+ T cells from the DLN of MSV/MuLV-infected mice and naive lymphocytes for [3H]-2DG accumulation. (B) Evaluation of Glut1 expression by Western blot. Noncontiguous lanes on the gel are indicated by the white line.
Figure 6
Figure 6. [18F]-FDG and [18F]-FAC differentially accumulate in innate and adaptive immune cell types in vivo.
MSV/MuLV-infected animals were injected with 1 mCi of [18F]-FDG or [18F]-FAC (n = 4 for each probe). The spleen, DLN, and tumors were dissociated, innate and adaptive immune cells were isolated, and the amount of radioactivity per cell in each cell type was quantified by gamma counting. Naive lymphocytes from unchallenged mice injected with each probe were measured as controls (n = 3 for each probe).
Figure 7
Figure 7. A defective adaptive immune response leads to reduced [18F]-FDG and [18F]-FAC signal in lymphoid organs but not the tumor.
(A) CB17SCID/SCID immune-defective mice were challenged with MSV/MuLV and imaged with [18F]-FDG and [18F]-FAC PET. Scans of immune-competent C57BL/6 mice challenged with MSV/MuLV during the same experiment are shown for comparison with each probe. (B) A quantitative comparison of [18F]-FDG and [18F]-FAC probe accumulation in the tumor regions of C57BL/6 and CB17SCID/SCID mice (n = 3 for each group, *P < 0.05).

References

    1. Cramer T, et al. HIF-1alpha is essential for myeloid cell-mediated inflammation. Cell. 2003;112(5):645–657. doi: 10.1016/S0092-8674(03)00154-5. - DOI - PMC - PubMed
    1. Fox CJ, Hammerman PS, Thompson CB. Fuel feeds function: energy metabolism and the T-cell response. Nat Rev Immunol. 2005;5(11):844–852. doi: 10.1038/nri1710. - DOI - PubMed
    1. Frauwirth KA, et al. The CD28 signaling pathway regulates glucose metabolism. Immunity. 2002;16(6):769–777. doi: 10.1016/S1074-7613(02)00323-0. - DOI - PubMed
    1. Woodland RT, et al. Multiple signaling pathways promote B lymphocyte stimulator dependent B-cell growth and survival. Blood. 2008;111(2):750–760. doi: 10.1182/blood-2007-03-077222. - DOI - PMC - PubMed
    1. Pearce EL, et al. Enhancing CD8 T-cell memory by modulating fatty acid metabolism. Nature. 2009;460(7251):103–107. - PMC - PubMed

Publication types

Substances