. 2010 Jun;120(6):2144-55.
doi: 10.1172/JCI42021. Epub 2010 May 17.

Gata3-deficient mice develop parathyroid abnormalities due to dysregulation of the parathyroid-specific transcription factor Gcm2

Affiliations

Gata3-deficient mice develop parathyroid abnormalities due to dysregulation of the parathyroid-specific transcription factor Gcm2

Irina V Grigorieva et al. J Clin Invest. 2010 Jun.

Abstract

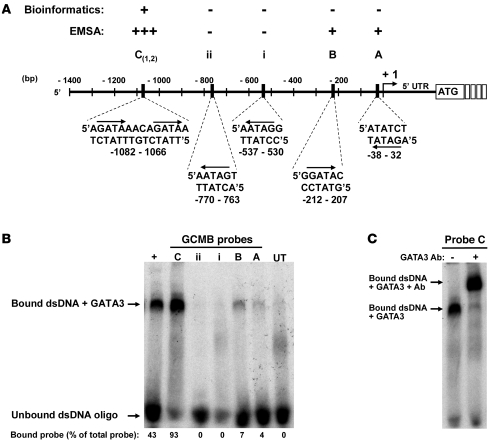
Heterozygous mutations of GATA3, which encodes a dual zinc-finger transcription factor, cause hypoparathyroidism with sensorineural deafness and renal dysplasia. Here, we have investigated the role of GATA3 in parathyroid function by challenging Gata3+/- mice with a diet low in calcium and vitamin D so as to expose any defects in parathyroid function. This led to a higher mortality among Gata3+/- mice compared with Gata3+/+ mice. Compared with their wild-type littermates, Gata3+/- mice had lower plasma concentrations of calcium and parathyroid hormone (PTH) and smaller parathyroid glands with a reduced Ki-67 proliferation rate. At E11.5, Gata3+/- embryos had smaller parathyroid-thymus primordia with fewer cells expressing the parathyroid-specific gene glial cells missing 2 (Gcm2), the homolog of human GCMB. In contrast, E11.5 Gata3-/- embryos had no Gcm2 expression and by E12.5 had gross defects in the third and fourth pharyngeal pouches, including absent parathyroid-thymus primordia. Electrophoretic mobility shift, luciferase reporter, and chromatin immunoprecipitation assays showed that GATA3 binds specifically to a functional double-GATA motif within the GCMB promoter. Thus, GATA3 is critical for the differentiation and survival of parathyroid progenitor cells and, with GCM2/B, forms part of a transcriptional cascade in parathyroid development and function.


Figures

Figure 1
Figure 1. Effects of low calcium/vitamin D diet on survival and plasma calcium and PTH concentrations.
(A) Gata3+/+ (wild-type) and Gata3+/– mice were placed at weaning (day 0) on a low calcium (0.001%)/vitamin D (0.0 iU/g) diet. Survival of Gata3+/– mice on the low calcium/vitamin D diet was significantly reduced. Sudden death occurred in Gata3+/– mice after 13 days on the low calcium/vitamin D diet. By day 27, there were less than 50% Gata3+/– mice surviving, and the study was terminated. In contrast, more than 95% of the Gata3+/+ mice survived (P < 0.001). Numbers of mice in each group are indicated on the right, and number of deaths are shown in parentheses. (B) Plasma-adjusted calcium and PTH concentrations were assessed 12 days after weaning while on control (0.95% calcium and 4.5 iU/g vitamin D) or low calcium/vitamin D diets. Gata3+/+ and Gata3+/– mice had similar plasma calcium concentrations on the control diet but became significantly hypocalcemic on the low calcium/vitamin D diet, although the Gata3+/– mice had significantly lower plasma calcium concentrations than their Gata3+/+ littermates. (C) Gata3+/+ and Gata3+/– mice had similar plasma PTH concentrations on the control diet, and this rose significantly in response to the low calcium/vitamin D diet, although the elevation in plasma PTH was less in the Gata3+/– mice. Gata3+/+ (black bars); Gata3+/– (gray bars). Error bars represent SEM. #P < 0.000001, Gata3+/+ mice on control versus low diet; ϕP < 0.000001, Gata3+/– mice on control versus low diet; *P < 0.01.
Figure 2
Figure 2. Parathyroid histology and proliferation studies in Gata3+/– and Gata3–/– mice.
(A) Parathyroid size in Gata3+/+ and Gata3+/– mice after 12 days, after weaning, on control or low calcium/vitamin D diets. H&E-stained parathyroid sections (top). Scale bars: 50 μm. Parathyroid size assessed by cross-sectional area analysis of longitudinally cut serial sections (6 microns) from 5–6 animals per group (n) and corrected for body weight (μm2/g) in Gata3+/+ (black bars) and Gata3+/– (gray bars) mice. (B) Parathyroid proliferation rates assessed by Ki-67 immunostaining. Nuclear Ki-67 immunostaining in parathyroid cells (top). Scale bars: 50 μm. Insets show details at higher magnification (×100), and arrows point to nuclear staining. Ki-67 proliferation rate (Ki-67–positive cells/total number of cells) in Gata3+/+ (black bars) and Gata3+/– (gray bars) mice. *P < 0.05. (C) Studies of parathyroid-thymus primordia in E12.5 embryos. H&E staining (top panel) and corresponding serial section immunostained with CaSR antibody (bottom panel). Scale bars: 50 μm. P, parathyroid; tm, thymus; vnt, vagus nerve trunk. (D) Sagittal sections of pharyngeal pouches and pharynx (phx) from E11.5 embryos hybridized with Gcm2 riboprobe to identify the parathyroid domain of the common parathyroid-thymus primordium (arrows) arising from the third pharyngeal pouch. Scale bars: 100 μm (top panels); 50 μm (bottom panels). h, heart. (E) Volume of third pharyngeal pouch in E11.5 embryos (n = 6 of each genotype) and the proportion of Gcm2-expressing cells. *P < 0.02; **P < 0.001; ***P < 0.002. P values calculated using Student’s t test. Error bars represent SEM.
Figure 3
Figure 3. Mapping of the GCMB transcription start sites by 5' RACE.
(A) Representation of human GCMB gene showing coding exons (white boxes) and 2 alternatively transcribed first exons (1 and 1a), which contain 5' UTRs (gray boxes). Transcription start sites are marked +1 and represent the longest 5' RACE amplicons. Primer sequences (arrows; forward, F1 and F1a; and reverse, R1 and R2) used for amplification of exon 1a and exon 1 are shown. (B) Detection of transcript-specific PCR products after 20 cycles of amplification using human parathyroid tumor RNA, at 2 concentrations (n, neat; 1/20, 20-fold dilution of neat). The splice variant has a shorter exon 1 and yields products of 331 bp and 454 bp. (C) Representation of primer positions and expected sizes of transcripts. (D) Human GCMB 5' upstream sequence. Locations of previously reported (32) transcription start site (*) isolated from human fetal brain and one identified (TSS and +1) from human parathyroids by this study are indicated. An additional transcription start site that was also identified in a splice variant (SV) is shown. Putative GATA3-binding sites (AC) are in bold; GATA motifs in the reverse orientation are indicated as i and ii; oligonucleotide sequences used for EMSAs are solid underlines; forward primers (Luc-c+ and Luc-c) used for the luciferase reporter constructs are indicated by arrows; GCMB-RX primer is indicated by the broken underline; and putative TATA box is boxed.
Figure 4
Figure 4. Analysis of DNA binding by GATA3 protein to putative GATA motifs in upstream sequence of GCMB.
(A) Diagram showing location of 3 putative GATA sites (A to C) in the 1400-bp sequence upstream of the transcription site (+1) of the GCMB gene. The direction of GATA motifs and their positions on the forward or reverse DNA strands are shown (arrows). Bioinformatic analysis of the 1400-bp sequence predicted only site C as a putative binding site of GATA3 (marked +); sites A and B and motifs i and ii were not predicted by this analysis (marked –). Binding by GATA3 protein to each site or motif assessed by EMSAs (B) is indicated (+++, strong; +, weak; –, absent). (B) EMSAs using nuclear extracts from COS-7 cells, transfected with the GATA3 expression vector. Binding reactions utilized a radiolabeled (32P) double-stranded (ds) oligonucleotide containing putative GATA site (AC). Control binding reactions using untransfected (UT) cells and probes containing the consensus GATA binding site (+) or GATA motifs (i and ii) in the reverse orientation were performed. Densitometry revealed that more than 90% of ds oligonucleotide C was bound, but less than 10% of the ds oligonucleotides A and B were bound, and 0% of the oligonucleotides i and ii were bound. (C) Use of an anti-GATA3 antibody in the binding reaction (+) with ds oligonucleotide containing GATA site C revealed a supershift, indicating that the complex was specific for the GATA3 protein.
Figure 5
Figure 5. Luciferase reporter assays.
(A) Expression of parathyroid-specific genes assessed by RT-PCR in cell lines COS-1, COS-7, HEK-293, HK-2, HKC-8, and human parathyroid adenoma and kidney. Endogenous expression of GATA3 and FOG2 was detected only in HEK-293 cells, which were therefore used in luciferase reporter assays. (B) Assessment of GATA motifs using luciferase reporter assays in HEK-293 cells. The 1.2-kb DNA sequence containing GATA motifs A–C (Figure 4) was cloned upstream of the luciferase gene in a reporter construct. HEK-293 cells were transiently cotransfected with a GATA3 expression vector or an empty vector (pcDNA3.1), lysed after 48 hours, and luminescence measured. The 1.2-kb region upstream of the GCMB gene (Luc-c+) drove expression of the luciferase gene 20-fold higher than the promoter-less construct, pGL3-basic. Cotransfecting with a GATA3 expression vector resulted in a significant (P < 0.05) increase in the activity, by 2-fold. A deletion construct that lacked the double-GATA site (Luc-c, Figure 3) or constructs in which both GATA motifs were mutated to CATA (Luc-c m1+2), or individually (Luc-c m1 and Luc-c m2) demonstrated a loss in transactivation by GATA3. A reporter construct (Luc-c only) that had the 161-bp sequence of the GCMB promoter containing the double-GATA site placed directly upstream of the luciferase gene did not increase the transcription activity, but cotransfection with GATA3 significantly (P < 0.001) increased the reporter activity, by 10- to 15-fold. Mean ± SEM of 3 independent experiments, each performed in triplicate wells, is shown.
Figure 6
Figure 6. ChIP assays show occupancy of the GCMB promoter by GATA3 in parathyroid tumor cells.
(A) Chromatin prepared from parathyroid tumor cells using 3 chromatin sonication conditions. Sonication with 5–10 pulses produced the optimum DNA fragment size range (200–1000 bp) for ChIP reactions. (B) Western blot analysis of the sonicated chromatin using 2 different mouse monoclonal antibodies (HG3-31 and HG3-35) revealed the presence of the intact 50-kDa GATA3 protein. Detection of the intact 70/75-kDa lamin A/C nuclear protein was used as a control. (C) Analysis of chromatin immunoprecipitated with GATA3 antibodies, HG3-31 and HG3-35, and 2 isotype-matched control antibodies, RNApolII and IgG. Purified DNA fragments after ChIP reactions were amplified by PCR with 2 primer pairs specific for the GCMB and GAPDH promoter regions. GAPDH served as a positive control for RNApolII and a negative control for GATA3 antibodies. (D) Quantification of PCR products by SYBR Green quantitative PCR using primers specific for the GCMB and GAPDH promoter regions. The GATA3-independent housekeeping gene GAPDH served as positive control for the RNApolII antibody ChIP, which demonstrated a 7-fold enrichment over IgG ChIP (P < 0.01). (E) Quantification of PCR products by SYBR Green quantitative PCR using primers specific for the GCMB promoter region. This confirmed the enrichment of the GCMB promoter DNA fragments immunoprecipitated with GATA3 antibodies over those immunoprecipitated with IgG and showed a 6.5- and 7.5-fold increase with HG2-31 and HG3-35 antibodies, respectively (*P < 0.01). Results are shown as the mean ± SEM of 3 independent ChIP reactions.

References

    1. Van Esch H, et al. GATA3 haplo-insufficiency causes human HDR syndrome. Nature. 2000;406(6794):419–422. - PubMed
    1. Simon MC. Gotta have GATA. Nat Genet. 1995;11(1):9–11. - PubMed
    1. Fox AH, Liew C, Holmes M, Kowalski K, Mackay J, Crossley M. Transcriptional cofactors of the FOG family interact with GATA proteins by means of multiple zinc fingers. EMBO J. 1999;18(10):2812–2822. doi: 10.1093/emboj/18.10.2812. - DOI - PMC - PubMed
    1. Nesbit MA, et al. Characterization of GATA3 mutations in the hypoparathyroidism, deafness, and renal dysplasia (HDR) syndrome. J Biol Chem. 2004;279(21):22624–22634. doi: 10.1074/jbc.M401797200. - DOI - PubMed
    1. Ali A, et al. Functional characterization of GATA3 mutations causing the hypoparathyroidism-deafness-renal (HDR) dysplasia syndrome: insight into mechanisms of DNA binding by the GATA3 transcription factor. Hum Mol Genet. 2007;16(3):265–275. doi: 10.1093/hmg/ddl454. - DOI - PubMed

Publication types

MeSH terms