

Decreased exposure to sunitinib due to concomitant administration of ifosfamide: results of a phase I and pharmacokinetic study on the combination of sunitinib and ifosfamide in patients with advanced solid malignancies
- PMID: 20485286
- PMCID: PMC2883699
- DOI: 10.1038/sj.bjc.6605696
Decreased exposure to sunitinib due to concomitant administration of ifosfamide: results of a phase I and pharmacokinetic study on the combination of sunitinib and ifosfamide in patients with advanced solid malignancies
Abstract
Background: This study aimed to define the maximally tolerated dose (MTD) of sunitinib combined with two different infusion schedules of ifosfamide.
Methods: Patients with advanced solid tumours, good performance score, good organ function, and no standard therapy available were eligible. Continuous once daily sunitinib, in escalating doses per cohort, was combined with ifosfamide, 9 g m(-2) for 3 days or 6 g m(-2) for 5 days, administered every 3 weeks. Pharmacokinetic (PK) and pharmacodynamic (PD) assessments were performed.
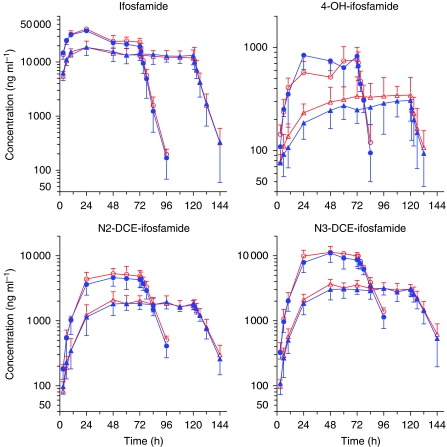
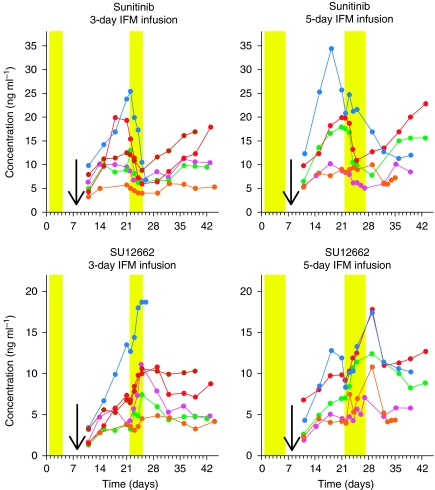
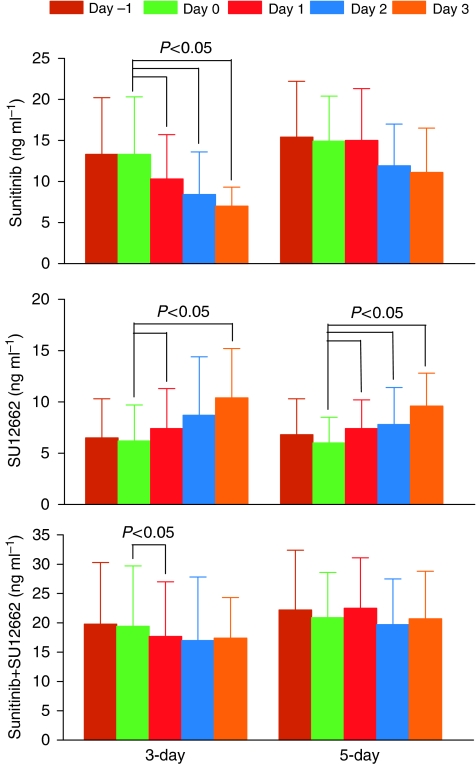
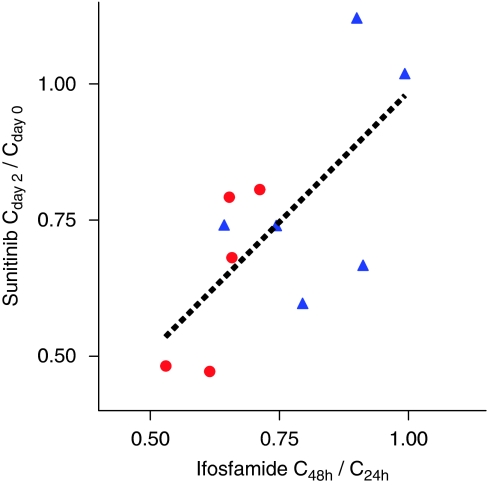
Results: With growth-factor support, the MTD of sunitinib combined with either ifosfamide schedule was 12.5 mg in 32 patients enrolled. Neutropenia-related adverse events were dose-limiting toxicities. Sunitinib did not affect ifosfamide PK. Ifosfamide significantly decreased exposure to sunitinib and increased exposure to its metabolite, SU12662. No consistent changes in PD parameters were observed.
Conclusion: With growth-factor support, the MTD of sunitinib with both ifosfamide schedules was 12.5 mg. Ifosfamide produced decreased sunitinib blood levels because of CYP3A induction. As PK interactions cannot explain the relatively low sunitinib doses that can be combined with ifosfamide, synergy in toxicity is likely. Whether this also holds true for anti-tumour activity needs to be further explored.
Figures
Similar articles
-
A phase I study of sunitinib combined with modified FOLFOX6 in patients with advanced solid tumors.Cancer Chemother Pharmacol. 2012 Jul;70(1):65-74. doi: 10.1007/s00280-012-1880-4. Epub 2012 May 24. Cancer Chemother Pharmacol. 2012. PMID: 22623210 Free PMC article. Clinical Trial.
-
Sunitinib in combination with gemcitabine for advanced solid tumours: a phase I dose-finding study.Br J Cancer. 2013 Apr 16;108(7):1393-401. doi: 10.1038/bjc.2013.96. Epub 2013 Mar 19. Br J Cancer. 2013. PMID: 23511559 Free PMC article. Clinical Trial.
-
A phase I dose-escalation and pharmacokinetic study of sunitinib in combination with pemetrexed in patients with advanced solid malignancies, with an expanded cohort in non-small cell lung cancer.Cancer Chemother Pharmacol. 2012 Mar;69(3):709-22. doi: 10.1007/s00280-011-1755-0. Epub 2011 Oct 12. Cancer Chemother Pharmacol. 2012. PMID: 21989766 Free PMC article. Clinical Trial.
-
The current status and evolving role of sunitinib in non-small cell lung cancer.J Thorac Oncol. 2008 Jun;3(6 Suppl 2):S119-23. doi: 10.1097/JTO.0b013e318174e9be. J Thorac Oncol. 2008. PMID: 18520293 Review.
-
Relationship between exposure to sunitinib and efficacy and tolerability endpoints in patients with cancer: results of a pharmacokinetic/pharmacodynamic meta-analysis.Cancer Chemother Pharmacol. 2010 Jul;66(2):357-71. doi: 10.1007/s00280-009-1170-y. Epub 2009 Dec 5. Cancer Chemother Pharmacol. 2010. PMID: 19967539 Review.
Cited by
-
Clinical pharmacokinetics of tyrosine kinase inhibitors: focus on pyrimidines, pyridines and pyrroles.Clin Pharmacokinet. 2011 Sep;50(9):551-603. doi: 10.2165/11593320-000000000-00000. Clin Pharmacokinet. 2011. PMID: 21827214
-
Pazopanib exposure decreases as a result of an ifosfamide-dependent drug-drug interaction: results of a phase I study.Br J Cancer. 2014 Feb 18;110(4):888-93. doi: 10.1038/bjc.2013.798. Epub 2013 Dec 24. Br J Cancer. 2014. PMID: 24366297 Free PMC article. Clinical Trial.
-
Targeted antiangiogenic agents in combination with cytotoxic chemotherapy in preclinical and clinical studies in sarcoma.Clin Sarcoma Res. 2016 Jun 7;6:9. doi: 10.1186/s13569-016-0049-z. eCollection 2016. Clin Sarcoma Res. 2016. PMID: 27274393 Free PMC article. Review.
-
A dose-escalating phase I of imatinib mesylate with fixed dose of metronomic cyclophosphamide in targeted solid tumours.Br J Cancer. 2013 Nov 12;109(10):2574-8. doi: 10.1038/bjc.2013.648. Epub 2013 Oct 22. Br J Cancer. 2013. PMID: 24149182 Free PMC article. Clinical Trial.
-
Phase I trial of sorafenib in combination with ifosfamide in patients with advanced sarcoma: a Spanish group for research on sarcomas (GEIS) study.Invest New Drugs. 2014 Apr;32(2):287-94. doi: 10.1007/s10637-013-9989-9. Epub 2013 Jun 26. Invest New Drugs. 2014. PMID: 23801301 Clinical Trial.
References
-
- Baratte S, Sarati S, Frigerio E, James CA, Ye C, Zhang Q (2004) Quantitation of SU11248, an oral multi-target tyrosine kinase inhibitor, and its metabolite in monkey tissues by liquid chromatography with tandem mass spectrometry following semi-automated liquid-liquid extraction. J Chromatogr A 1024: 87–94 - PubMed
-
- Bello C, Houk B, Sherman L, Misbah S, Sarapa N, Smeraglia J, Haung X (2005) Effect of rifampin on the pharmacokinetics of SU11248 in healthy volunteers. J Clin Oncol 23: 3078
-
- Boddy AV, Cole M, Pearson AD, Idle JR (1995) The kinetics of the auto-induction of ifosfamide metabolism during continuous infusion. Cancer Chemother Pharmacol 36: 53–60 - PubMed
-
- Boucher Y, Jain RK (1992) Microvascular pressure is the principal driving force for interstitial hypertension in solid tumors: implications for vascular collapse. Cancer Res 52: 5110–5114 - PubMed
Publication types
MeSH terms
Substances
LinkOut - more resources
Full Text Sources
Research Materials
