. 2010 May 20;465(7296):368-72.
doi: 10.1038/nature08996.

Opposing roles for calcineurin and ATF3 in squamous skin cancer

Affiliations

Opposing roles for calcineurin and ATF3 in squamous skin cancer

Xunwei Wu et al. Nature. .

Abstract

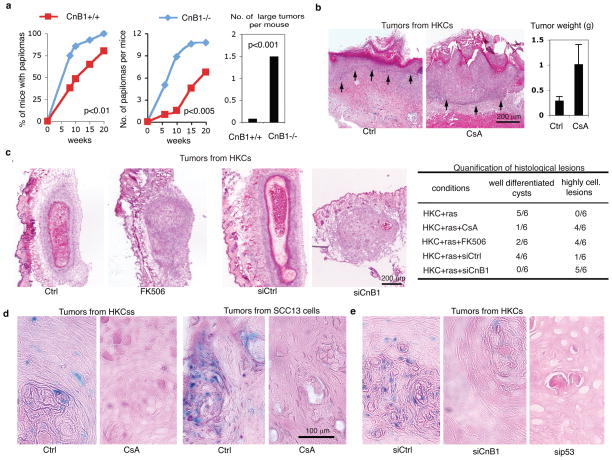
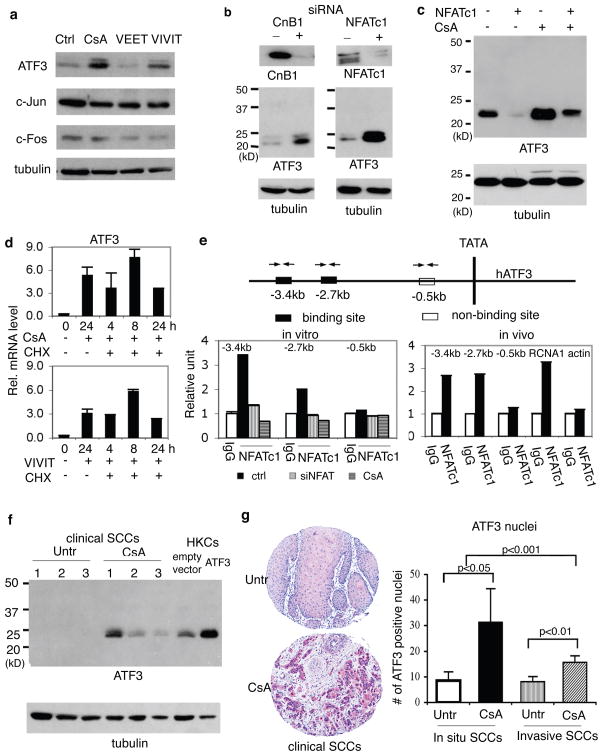
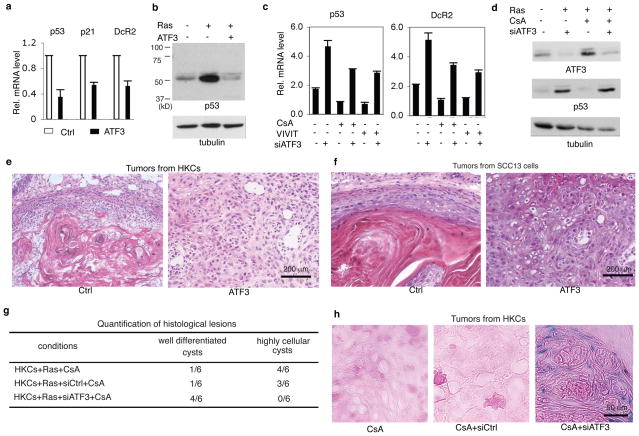
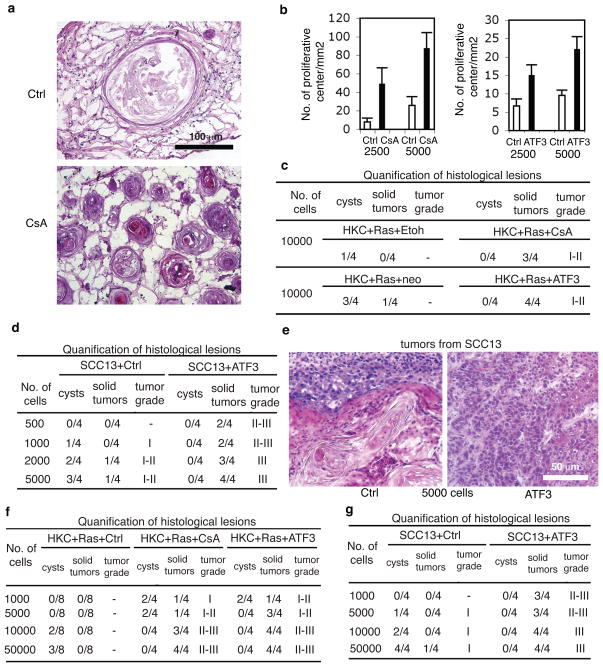
Calcineurin inhibitors such as cyclosporin A (CsA) are the mainstay of immunosuppressive treatment for organ transplant recipients. Squamous cell carcinoma (SCC) of the skin is a major complication of treatment with these drugs, with a 65 to 100-fold higher risk than in the normal population. By contrast, the incidence of basal cell carcinoma (BCC), the other major keratinocyte-derived tumour of the skin, of melanoma and of internal malignancies increases to a significantly lesser extent. Here we report that genetic and pharmacological suppression of calcineurin/nuclear factor of activated T cells (NFAT) function promotes tumour formation in mouse skin and in xenografts, in immune compromised mice, of H-ras(V12) (also known as Hras1)-expressing primary human keratinocytes or keratinocyte-derived SCC cells. Calcineurin/NFAT inhibition counteracts p53 (also known as TRP53)-dependent cancer cell senescence, thereby increasing tumorigenic potential. ATF3, a member of the 'enlarged' AP-1 family, is selectively induced by calcineurin/NFAT inhibition, both under experimental conditions and in clinically occurring tumours, and increased ATF3 expression accounts for suppression of p53-dependent senescence and enhanced tumorigenic potential. Thus, intact calcineurin/NFAT signalling is critically required for p53 and senescence-associated mechanisms that protect against skin squamous cancer development.


Figures

Figure 1
Figure 1. Calcineurin/NFAT inhibition promotes keratinocyte tumour formation
a, Multistep skin carcinogenesis of mice with keratinocyte-specific CnB1 deletion (CnB1 −/−) together with littermate controls (CnB1+/+). Numbers of total and large (>4.5mm diameter) tumours were determined weekly. For histology see Suppl. Fig. 1. b, Grafting of H-rasV12 expressing HKCs onto Scid mice plus/minus subsequent CsA treatment. Epidermal-dermal junction: black arrows. For higher magnification images and experimental conditions see Suppl. Fig. 2a. c, H-rasV12 expressing HKCs were injected at dermal-epidermal junction of Scid mice plus/minus subsequent CsA or FK506 treatment. Similar assays were performed with H-rasV12 expressing HKCs with siRNA-mediated CnB1 knockdown (siCnB1) versus control (siCtrl). Histological analysis was 10 days later, summarized on the right. For higher magnification images and experimental conditions: Suppl. Fig. 2b,c. d and e, Lesions formed by H-rasV12 expressing HKCs or SCC13 cells in mice plus/minus CsA-treatment (d) or plus/minus CnB1 and p53 knockdown (e) were analyzed by in situ chromogenic assay for senescence associated β-galactosidase activity. For additional images, data quantification, experimental conditions see suppl. Figs. 3–5.
Figure 2
Figure 2. Calcineurin/NFAT signalling negatively controls ATF3 expression
a and b, HKCs plus/minus CsA or VIVIT treatment (a) or CnB1 or NFATc1 knockdown (b) were analyzed in parallel with controls by immunoblotting. Similar results were obtained at mRNA level (Suppl. Fig. 8a–c). c, HKCs infected with retroviruses expressing constitutively active NFATc1 (+) or GFP control (−) plus/minus subsequent CsA treatment were analyzed for ATF3 expression. Similar results were obtained by real time RT-PCR (Suppl. Fig. 8f). d, HKCs plus/minus CsA/VIVIT treatment and cycloheximide exposure were analyzed at various times (hours) for ATF3 expression by real time RT-PCR. Error bars represent mean ± s.d (n = 3 replicates). e, Extracts of HKCs plus/minus CsA treatment or NFACTc1 knockdown (left panel) or intact human epidermis (right panel) were processed for Chip with anti-NFATc1 antibodies or non-immune IgGs, followed by real time PCR of ATF3 promoter regions containing and lacking high-affinity NFATc1 binding sites (black and white boxes in the map above). Chip assays of the NFAT binding region of the calcipressin (RCNA1) gene, and a β-actin genomic region without NFAT binding sites were included. f, SCCs from 3 patients under CsA treatment and from untreated patients (Untr) from the general population were analyzed by immunoblotting for ATF3 expression, in parallel with HKCs infected with an ATF3 expressing retrovirus (ATF3) versus empty vector control. Similar differences in ATF3 mRNA expression were observed with an independent set of patients (Suppl. Fig. 9a). g, tissue arrays of cutaneous SCCs from patients under CsA treatment versus general untreated population (Untr) were analyzed for ATF3 expression by immunohistochemistry. Representative staining is shown along with quantification of ATF3 positive nuclei in each visual field of tumour tissues. Error bars represent mean ± s.d (n = 18, 16, 126 and 127 tumors per group, in the order).
Figure 3
Figure 3. ATF3 up-regulation enhances keratinocyte tumour formation and suppresses cancer cell senescence
a, HKCs infected with ATF3 expressing (ATF3) and control retroviruses were analyzed by real time RT-PCR for indicated genes. Error bars represent mean ± s.d (n = 3 replicates). b, HKCs plus/minus infection with ATF3 and H-rasV12 expressing retroviruses were analyzed for p53 expression by immunoblotting. c, HKCs plus/minus ATF3 knockdown and CsA/VIVIT treatment were analyzed by real time RT-PCR for p53 and DcR2 expression. Additional results are shown in Suppl. Fig. 10a. d, HKCs plus/minus H-rasV12 expression, ATF3 knockdown and CsA treatment as indicated were analyzed for ATF3 and p53 expression by immunoblotting. For densitometric quantification and experimental conditions see Suppl. Fig. 10b. e and f, H-rasV12 expressing HKCs (e) or SCC13 cells (f) infected with ATF3 expressing and control retroviruses were injected at the dermal-epidermal junction of Scid mice. Shown are histological images of lesions recovered 6 weeks later. For quantification see Suppl. Fig. 11a,b. g, H-rasV12 expressing HKCs plus/minus ATF3 knockdown were injected at the dermal-epidermal junction of Scid mice, followed by CsA treatment. Mice were sacrificed 10 days later. For histological images see Suppl. Fig. 11c. h Lesions from the previous experiment were analyzed for SA-β-galactosidase activity. Low magnification images and quantification are shown in Suppl. Fig. 11d.
Figure 4
Figure 4. Calcineurin inhibition and increased ATF3 enhance cancer initiating cell populations
a–c, Ha-rasV12 expressing HKCs sorted for high α6 integrin and low CD71 expression (α6briCD71dim cells) were injected in the indicated numbers into NOD/SCID-Il2rg(−/−) mice, plus/minus subsequent CsA treatment for 4 weeks. Similar experiments were also performed with sorted H-rasV12expressing HKCs plus/minus ATF3 overexpression. a: histological images of nodules formed by 2,500 Ha-rasV12-HKCs in mice plus/minus CsA treatment. b, quantification of proliferative centers and, c, cysts or solid tumours formed by the indicated cell numbers. Error bars represent mean ± s.d (n = 4 nodules per condition). For low magnification images, quantification criteria and immunofluorescence analysis see Suppl. Fig. 12a,b. d and e, sorted α6briCD71dim populations of SCC13 cells plus/minus ATF3 overexpression were injected in the indicated numbers into Scid mice. Shown are quantification of the results and representative histological images. Experimental conditions were the same as with CD133 sorted cells (Suppl. Fig. 13). f and g, Cells dissociated from tumours formed by Ha-rasV12-HKCs in mice plus/minus CsA treatment, or with ATF3 overexpression (f) or from tumours formed SCC13 cells plus/minus ATF3 overexpression (g) were injected in decreasing numbers into secondary recipient mice (Scid), with tissue retrieval 4 weeks later. For representative images and experimental conditions see Suppl. Fig. 14.

References

    1. Euvrard S, Kanitakis J, Claudy A. Skin cancers after organ transplantation. N Engl J Med. 2003;348:1681–1691. - PubMed
    1. Horsley V, Aliprantis AO, Polak L, Glimcher LH, Fuchs E. NFATc1 balances quiescence and proliferation of skin stem cells. Cell. 2008;132:299–310. - PMC - PubMed
    1. Mammucari C, et al. Integration of Notch 1 and calcineurin/NFAT signaling pathways in keratinocyte growth and differentiation control. Dev Cell. 2005;8:665–676. - PubMed
    1. Santini MP, Talora C, Seki T, Bolgan L, Dotto GP. Cross talk among calcineurin, Sp1/Sp3, and NFAT in control of p21(WAF1/CIP1) expression in keratinocyte differentiation. Proc Natl Acad Sci U S A. 2001;98:9575–9580. - PMC - PubMed
    1. Aramburu J, et al. Affinity-driven peptide selection of an NFAT inhibitor more selective than cyclosporin A. Science. 1999;285:2129–2133. - PubMed

Publication types

MeSH terms