

Comparison of genome-wide variation between Malawians and African ancestry HapMap populations
- PMID: 20485449
- PMCID: PMC2909738
- DOI: 10.1038/jhg.2010.41
Comparison of genome-wide variation between Malawians and African ancestry HapMap populations
Abstract
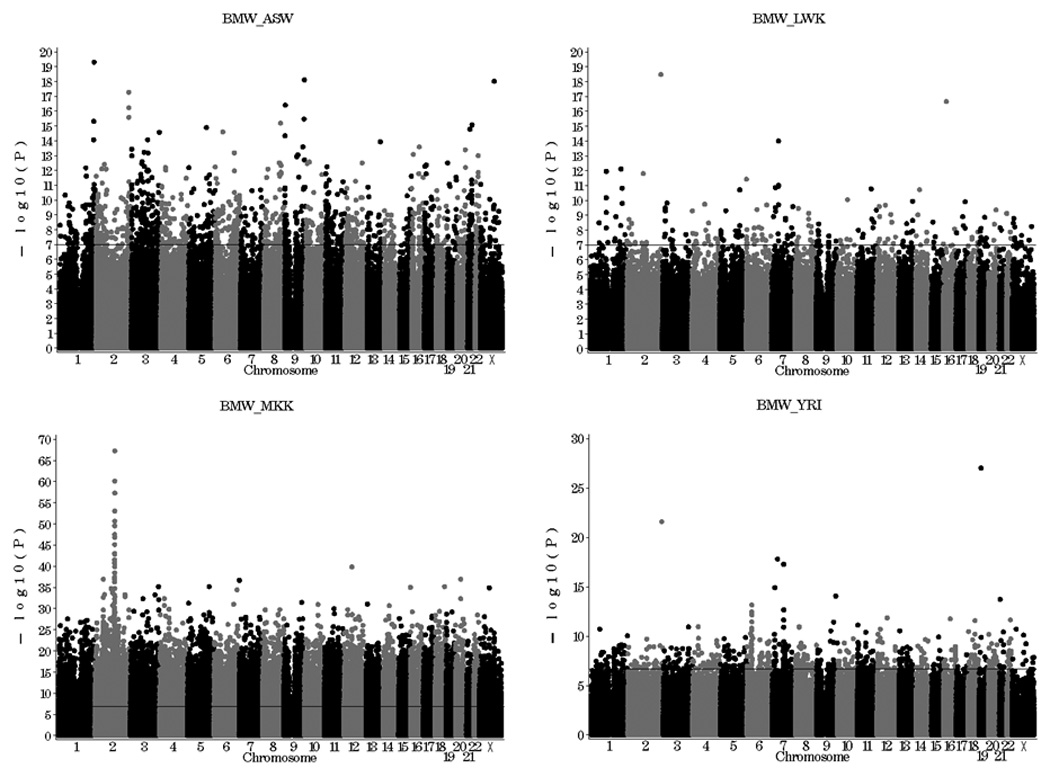
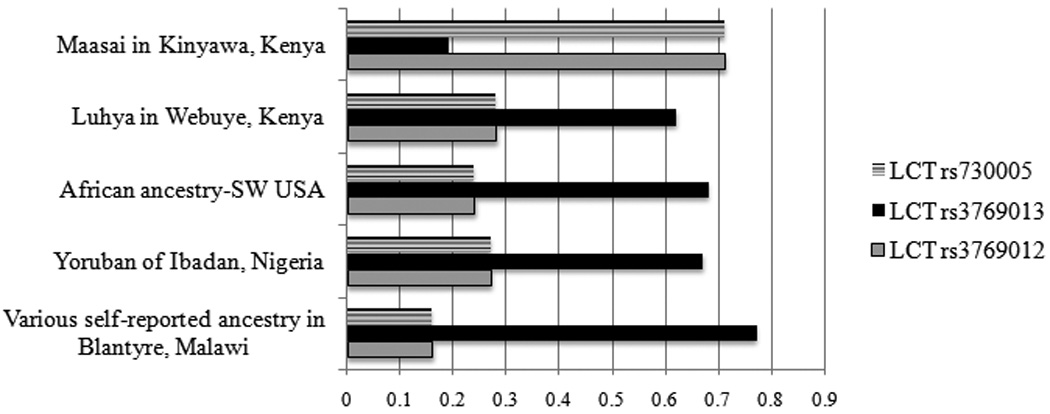
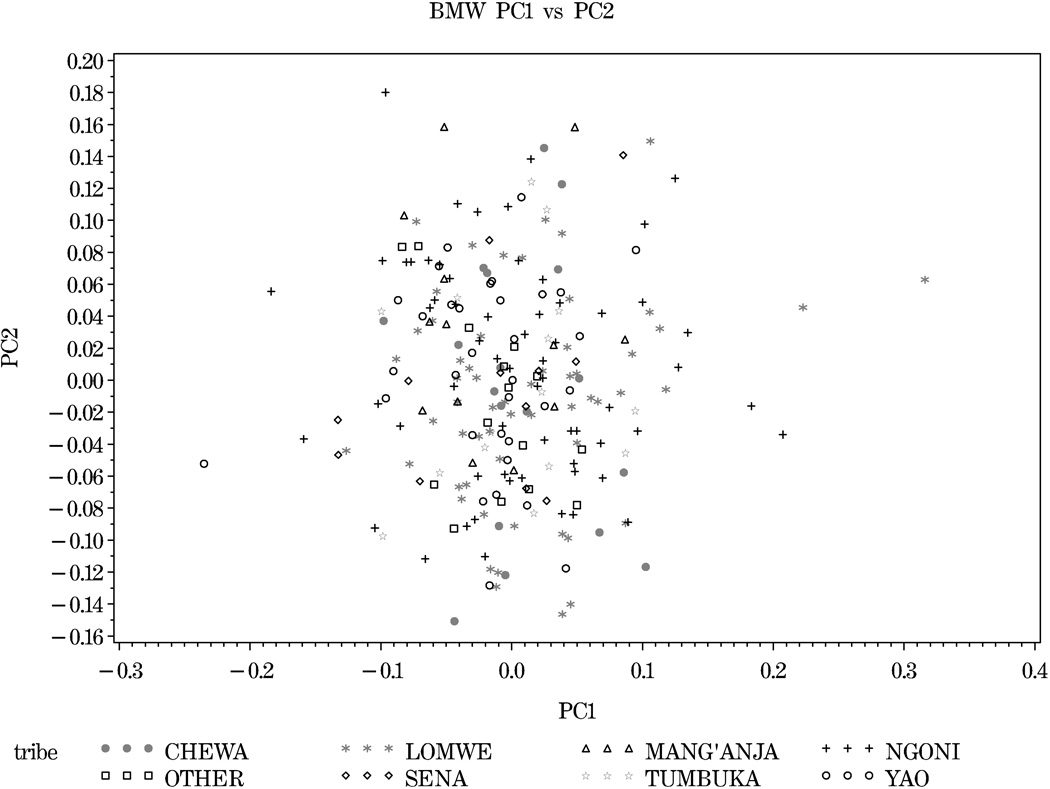
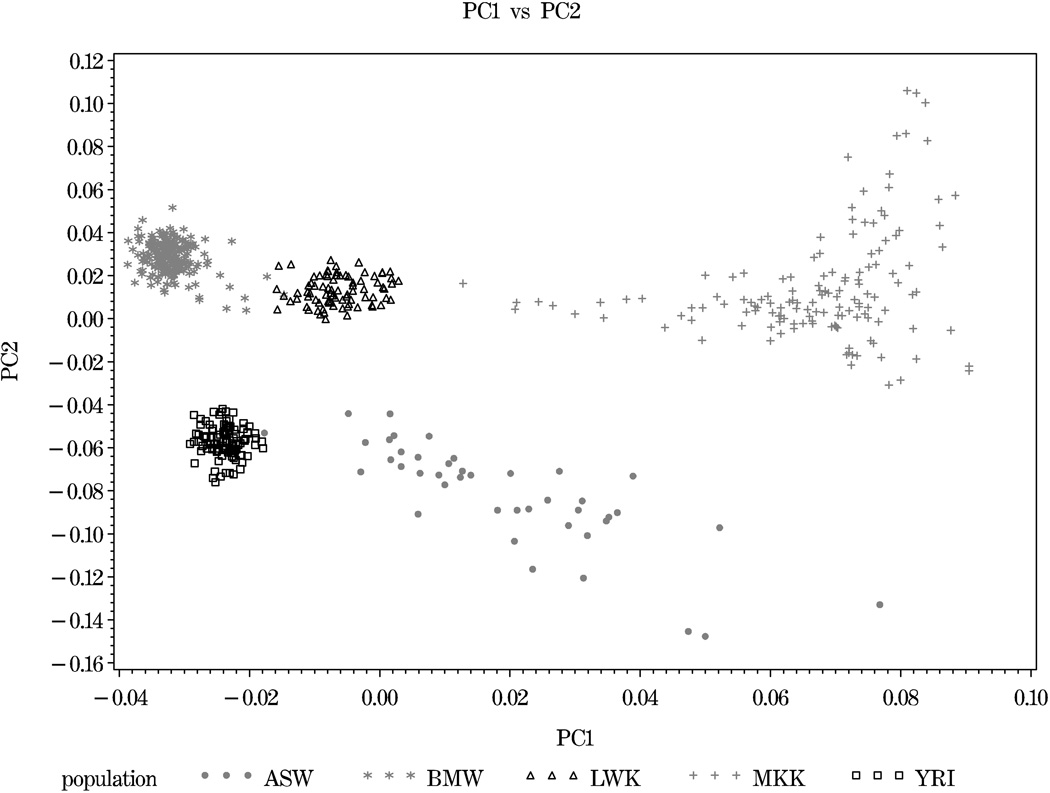
Understanding genetic variation between populations is important because it affects the portability of human genome-wide analytical methods. We compared genetic variation and substructure between Malawians and other African and non-African HapMap populations. Allele frequencies and adjacent linkage disequilibrium (LD) were measured for 617 715 single nucleotide polymorphisms (SNPs) across subject genomes. Allele frequencies in the Malawian population (N=226) were highly correlated with allele frequencies in HapMap populations of African ancestry (AFA, N=376), namely Yoruban in Ibadan, Nigeria (Spearman's r(2)=0.97), Luhya in Webuye, Kenya (r(2)=0.97), African Americans in the southwest United States (r(2)=0.94) and Maasai in Kinyawa, Kenya (r(2)=0.91). This correlation was much lower between Malawians and other ancestry populations (r(2)<0.52). LD correlations between Malawians and HapMap populations were strongest for the populations of AFA (AFA r(2)>0.82, other ancestries r(2)<0.57). Principal components analyses revealed little population substructure within our Malawi sample but provided clear distinction between Malawians, AFA populations and two European populations. Five SNPs within the lactase gene (LCT) had substantially different allele frequencies between the Malawi population and Maasai in Kenyawa, Kenya (rs3769013, rs730005, rs3769012, rs2304370; P-values <1 x 10(-33)).
Figures
References
-
- Marvelle AF, Lange LA, Qin L, Wang Y, Lange EM, Adair LS, et al. Comparison of ENCODE region SNPs between Cebu Filipino and Asian HapMap samples. J Hum Genet. 2007;52(9):729–737. - PubMed
-
- Arnold JC, Singh KK, Spector SA, Sawyer MH. Undiagnosed respiratory viruses in children. Pediatrics. 2008 Mar;121(3):e631–e637. - PubMed
-
- Ribas G, Gonzalez-Neira A, Salas A, Milne RL, Vega A, Carracedo B, et al. Evaluating HapMap SNP data transferability in a large-scale genotyping project involving 175 cancer-associated genes. Hum Genet. 2006 Feb;118(6):669–679. - PubMed
Publication types
MeSH terms
Grants and funding
LinkOut - more resources
Full Text Sources
Research Materials