. 2010 May 11:4:11.
doi: 10.3389/fncom.2010.00011. eCollection 2010.

Uncertainty of feedback and state estimation determines the speed of motor adaptation

Affiliations

Uncertainty of feedback and state estimation determines the speed of motor adaptation

Kunlin Wei et al. Front Comput Neurosci. .

Abstract

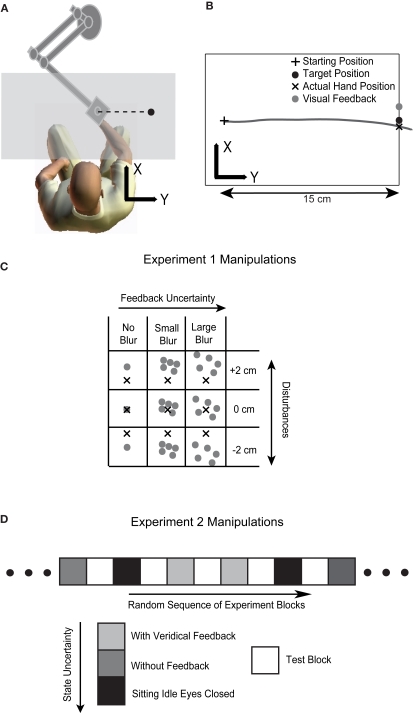
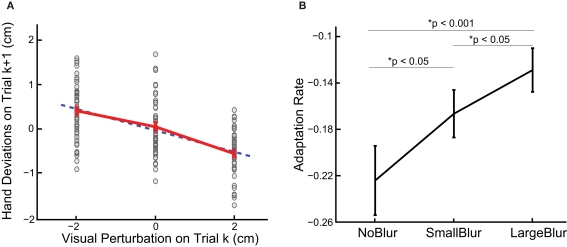
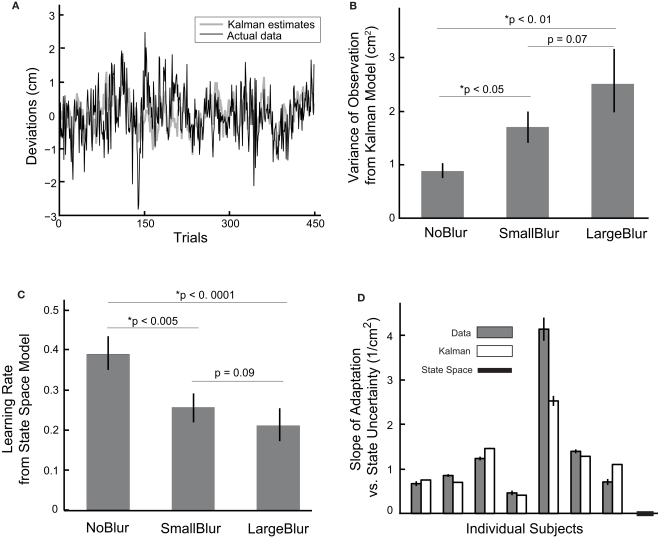
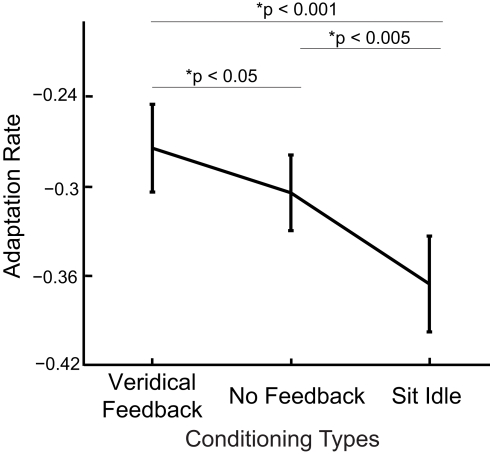
Humans can adapt their motor behaviors to deal with ongoing changes. To achieve this, the nervous system needs to estimate central variables for our movement based on past knowledge and new feedback, both of which are uncertain. In the Bayesian framework, rates of adaptation characterize how noisy feedback is in comparison to the uncertainty of the state estimate. The predictions of Bayesian models are intuitive: the nervous system should adapt slower when sensory feedback is more noisy and faster when its state estimate is more uncertain. Here we want to quantitatively understand how uncertainty in these two factors affects motor adaptation. In a hand reaching experiment we measured trial-by-trial adaptation to a randomly changing visual perturbation to characterize the way the nervous system handles uncertainty in state estimation and feedback. We found both qualitative predictions of Bayesian models confirmed. Our study provides evidence that the nervous system represents and uses uncertainty in state estimate and feedback during motor adaptation.

Keywords: Bayesian statistics; motor adaptation; motor learning; uncertainty.


Figures

Figure 1
Figure 1
Illustration of the experimental setup and procedures. (A) The experimental setup. The hand movement is performed underneath a projection screen (shown as a gray plane). Visual feedback including the cursor(s) representing the hand position and icons representing the starting and target position are displayed through a projector onto the projection screen. (B) A typical movement trajectory. The hand moves from a starting position to a target 15 cm away on the right. The cursor is only shown at the end of the movement and it is randomly perturbed in depth direction (x direction in the figure) either by −2, 0 or 2 cm. The trial shown is perturbed by 2 cm. (C) Manipulation of feedback uncertainty in Experiment 1. The grid shows the nine possible forms of visual feedback presented. The cross represents the actual hand position (invisible to the subject) when the hand crosses the target. The gray dot(s) represent the cursor(s) serving as visual feedback. The cursor is not only perturbed spatially but also randomly assigned one of three possible uncertainty levels: a single cursor (NoBlur), or five scattered cursors whose x and y locations are drawn from a zero-mean 2-D normal distribution with a standard deviation of 2 cm (SmallBlur) or 4 cm (LargeBlur). (D) Manipulation of state estimation uncertainty in Experiment 2. Trials are presented in different blocks and there is no blurring manipulation. Visual feedback is spatially perturbed in test blocks (30 s in duration), which are randomly interleaved with conditioning blocks. In conditioning blocks (60 s in duration), subjects either perform reaching movements with veridical visual feedback (the cursor reflecting the true hand location at the end of trial), or perform the task without visual feedback or simply sit with eyes closed.
Figure 2
Figure 2
(A) The data from a typical subject in the NoBlur condition. Deviations in depth direction from all trials plotted as a function of immediately preceding visual perturbations. Each dot represents a single reach and red error bars are means and standard errors for each visual disturbance. Data points are plotted as spreads in x direction for better visibility. Blue dash line is the linear regression line. (B) Adaptation rates from linear regressions are averaged over subjects for different blurring conditions (mean ± sem displayed). The p values of one-sided paired t-tests between blurring conditions are also shown.
Figure 3
Figure 3
(A) Deviations of the hand from the target from a typical subject are plotted together with the corresponding Kalman estimates. (B) Inferred R2 from the Kalman filter model, an indictor of feedback uncertainty, is plotted as a function of blurring conditions. The error bars stand for the means and standard errors across subjects. (C) Inferred learning rate B from the state space model is plotted as a function of blurring conditions. The error bars denote the means and standard errors across subjects. (D) Slopes of linear regressions of adaptation gains (the ratio between the correction and the perturbation) against state estimation uncertainty (quantified by variance of the state transition model, σk2) are plotted for each individual subject and for predictions from the Kalman filter model and the state space model. For individual subject data and the corresponding Kalman filter predictions, the error bars stand for 95% confidence interval for the slope estimates. Note some error bars are too small to illustrate in the current plotting scale. The state space model predicts a zero slope.
Figure 4
Figure 4
Adaptation rates are shown as a function of conditioning type (for inducing different levels of state estimation uncertainty). Averages over subjects are shown (mean ± sem displayed) together with p values of paired t-tests between conditions.

References

    1. Alais D., Burr D. (2004). The ventriloquist effect results from near-optimal bimodal integration. Curr. Biol. 14, 257–262 - PubMed
    1. Baddeley R. J., Ingram H. A., Miall R. C. (2003). System identification applied to a visuomotor task: near-optimal human performance in a noisy changing task. J. Neurosci. 23, 3066–3075 - PMC - PubMed
    1. Behrens T., Woolrich M., Walton M., Rushworth M. (2007). Learning the value of information in an uncertain world. Nat. Neurosci. 10, 1214–122110.1038/nn1954 - DOI - PubMed
    1. Brown L., Rosenbaum D., Sainburg R. (2003). Limb position drift: implications for control of posture and movement. J. Neurophysiol. 90, 3105–311810.1152/jn.00013.2003 - DOI - PMC - PubMed
    1. Burgar C., Lum P., Shor P., Van der Loos H. (2000). Development of robots for rehabilitation therapy: the Palo Alto VA/Stanford experience. J. Rehabil. Res. Dev. 376, 663–673 - PubMed