. 2010 May 13;6(5):e1000889.
doi: 10.1371/journal.ppat.1000889.

The Set3/Hos2 histone deacetylase complex attenuates cAMP/PKA signaling to regulate morphogenesis and virulence of Candida albicans

Affiliations

The Set3/Hos2 histone deacetylase complex attenuates cAMP/PKA signaling to regulate morphogenesis and virulence of Candida albicans

Denes Hnisz et al. PLoS Pathog. .

Abstract

Candida albicans, like other pleiomorphic fungal pathogens, is able to undergo a reversible transition between single yeast-like cells and multicellular filaments. This morphogenetic process has long been considered as a key fungal virulence factor. Here, we identify the evolutionarily conserved Set3/Hos2 histone deacetylase complex (Set3C) as a crucial repressor of the yeast-to-filament transition. Cells lacking core components of the Set3C are able to maintain all developmental phases, but are hypersusceptible to filamentation-inducing signals, because of a hyperactive cAMP/Protein Kinase A signaling pathway. Strikingly, Set3C-mediated control of filamentation is required for virulence in vivo, since set3Delta/Delta cells display strongly attenuated virulence in a mouse model of systemic infection. Importantly, the inhibition of histone deacetylase activity by trichostatin A exclusively phenocopies the absence of a functional Set3C, but not of any other histone deacetylase gene. Hence, our work supports a paradigm for manipulating morphogenesis in C. albicans through alternative antifungal therapeutic strategies.


Conflict of interest statement

The authors have declared that no competing interests exist.

Figures

Figure 1
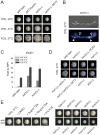
Figure 1. MTL homozygous set3Δ/Δ cells filament specifically in the opaque phase.
(A) Colony morphologies. MTL a/a set3Δ/Δ cells grow as wrinkled colonies in the opaque but not in the white phase at 25°C on Lee's agar plates containing 5 µg/ml Phloxin B, staining opaque cells pink. Images were taken after 5 days of incubation. Scale bar corresponds to 2 mm. (B) Opaque phase filaments of MTL a/a set3Δ/Δ cells on Lee's medium display pseudohyphal characteristics. Cells are elongated and constrictions are visible where two daughter cells stay attached after cell division. Bold arrowheads indicate nuclei stained with DAPI. Cell wall is stained with Calcofluor White. Empty arrowheads indicate cell wall constrictions. Scale bar corresponds to 5 µm. (C) The MTL a/a set3Δ/Δ mutant expresses the filament-specific ECE1 transcript at high levels in the opaque phase. qRT-PCR analysis was performed with cDNA samples derived from colonies shown in Figure1A. In addition, ECE1 expression level in white phase MTL a/a wild type cells grown on Lee's medium at 37°C for three days is added as a control. Transcript levels were normalized against the expression level of RIP1. qRT-PCR reactions were performed in triplicates and RNA isolated from two independent cultures were analyzed. Data are shown as mean + SD. (D) Colony morphologies of additional mutants of the putative Set3/Hos2 complex. Opaque phase MTL a/a cells deleted for the core subunit HOS2 (see text) form wrinkled colonies on Lee's medium at 25°C, similar to set3Δ/Δ cells, whereas mutants lacking the peripheral subunit HST1 form smooth colonies. In addition, SET3 is epistatic to HST1. Images were taken after five days of incubation. Scale bar corresponds to 2 mm.
Figure 2
Figure 2. Loss of SET3 promotes filamentation in C. albicans.
(A) Colony morphologies. set3Δ/Δ cells form wrinkled colonies on YPD at 37°C. Strains were grown for three days. FCS stands for YPD supplemented with 10% fetal calf serum. Scale bar corresponds to 2 mm. (B) The filaments of set3Δ/Δ cells on YPD at 37°C display true hyphal characteristics: parallel cell walls with perpendicular septa. Bold arrowheads indicate nuclei stained with DAPI. Cell wall is stained with Calcofluor White. Empty arrowheads indicate the septa. Scale bar corresponds to 5 µm. (C) set3Δ/Δ and hos2Δ/Δ mutants express the filament-specific ECE1 transcript at high levels on YPD at 37°C. qRT-PCR analysis was performed with cDNA samples derived from the colonies shown in Figure2A. Transcript levels were normalized against the expression level of RIP1. qRT-PCR reactions were performed in triplicates and RNA isolated from two independent cultures were analyzed. Data are shown as mean + SD. (D) Colony morphologies of additional mutants of the Set3 Complex. Cells deleted for the core subunits HOS2, SNT1 and SIF2 form wrinkled colonies on YPD at 37°C, whereas the deletion cells lacking the peripheral subunit HST1 form smooth colonies. In addition, SET3 is epistatic to HST1. Images were taken after three days of incubation. Scale bar corresponds to 2 mm. (E) (left panel) Trichostatin A treatment enhances filamentation. The displayed strain is a MTL a/a strain. (right panel) Trichostatin A treatment is phenocopied by genetic disruption of the Set3C, but none of the other putative histone deacetylases. Images were taken after three days of incubation at 37°C. Scale bar corresponds to 2 mm.
Figure 3
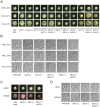
Figure 3. Lack of EFG1 suppresses hyperfilamentation of set3Δ/Δ and hos2Δ/Δ mutants.
(A) Colony morphologies of mutant strains with the indicated genotypes. Loss of CPH1 or EFG1 compromises the ability of cells to form filaments even under serum induction. EFG1 deletion is epistatic to the deletion of SET3 or HOS2, whereas CPH1 deletion is hypostatic. Deletion of SET1 in set3Δ/Δ and hos2Δ/Δ mutants has a mild synergistic effect. Strains were grown for three days on the media indicated. FCS stands for YPD supplemented with 10% fetal calf serum. Scale bar corresponds to 2 mm. (B) Microscopic analysis of the colonies shown on Figure 3A. On YPD at 37°C the wrinkled colonies of cph1Δ/Δ set3Δ/Δ cells consists of a mixture of yeast cells and hyphae, while efg1Δ/Δ set3Δ/Δ show the slightly elongated morphology of efg1Δ/Δ cells irrespective of the presence of serum. Scale bar corresponds to 5 µm. (C) Colony morphologies of mutant strains with the indicated genotypes. In opaque phase cells, EFG1 deletion is epistatic to the loss of SET3. Strains were grown at 25°C on Lee's agar plates containing 5 µg/ml Phloxin B. Images were taken after 5 days of incubation. Scale bar corresponds to 2 mm. (D) Microscopic analysis of the colonies shown in Figure 3C. Contrary to opaque set3Δ/Δ cells, no filamentous structures are present in the colonies formed by opaque efg1Δ/Δ or efg1Δ/Δ set3Δ/Δ cells. Scale bar corresponds to 5 µm.
Figure 4
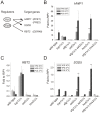
Figure 4. Loss of SET3 or HOS2 enhances induction of EFG1-dependent target genes.
(A) Scheme of the experimental approach. Expression profiles of the genes in parentheses are shown on Figure S4. qRT-PCR analysis was performed with cDNA samples derived from the colonies shown in Figure 2A and 3A. Transcript levels were normalized against the expression level of RIP1. qRT-PCR reactions were performed in triplicates and RNA isolated from two independent cultures were analyzed. Data are shown as mean + SD. (B) The expression of HWP1 is strongly induced in set3Δ/Δ and hos2Δ/Δ cells even on YPD at 37°C. HWP1 expression is abolished once EFG1 is deleted both in wild type and set3Δ/Δ or hos2Δ/Δ cells. Double asterisk indicates statistical significance of P<0.01 relative to wild type cells cultured under identical conditions (Student's t-test). (C) RBT2 is repressed by Tup1, but not by Set3 or Hos2 under all conditions tested. (D) The expression of SOD5 is strongly induced in set3Δ/Δ and hos2Δ/Δ cells upon a mild (YPD, 37°C) or strong (FCS, 37°C) inductive stimulus. Elevated SOD5 expression requires EFG1. Double asterisk indicates statistical significance of P<0.01 relative to wild type cells cultured under identical conditions (Student's t-test).
Figure 5
Figure 5. Adenine supplementation suppresses hyperfilamentation of set3Δ/Δ mutants.
(A) Colony morphologies of opaque phase MTL a/a strains. Opaque set3Δ/Δ cells form smooth colonies on Lee's medium supplemented with adenine. Images were taken after five days of incubation at 25°C on Lee's agar plates containing 5 µg/ml Phloxin B. (B) Microscopy of the colonies shown in Figure 5A. The opaque MTL a/a set3Δ/Δ cells do not filament in the presence of 100 µg/ml adenine. Scale bar corresponds to 5 µm. In panels (C), (D) and (E), the logic for the expression analysis is described in Figure 4A. qRT-PCR analysis was performed with cDNA samples derived from the colonies shown in Figure 3C and Figure 5A. Transcript levels were normalized against the expression level of RIP1. qRT-PCR reactions were performed in triplicates and RNA isolated from two independent cultures were analyzed. Data are shown as mean + SD. (C) HWP1 expression is strongly induced in opaque phase set3Δ/Δ cells, but the induction is suppressed by deletion of EFG1 or by supplementing the medium with 100 µg/ml adenine. Double asterisk indicates statistical significance of P<0.01 relative to wild type cells of the same phase cultured under identical conditions (Student's t-test). (D) Expression of SOD5 is induced in set3Δ/Δ opaque cells, but the induction is suppressed by deletion of EFG1 or by supplementing the medium with 100 µg/ml adenine. Double asterisk indicates statistical significance of P<0.01 relative to wild cells of the same phase cultured under identical conditions (Student's t-test). (E) RBT2 is repressed by Tup1, but not by Set3 or Hos2. (F) Colony morphologies on YPD medium without or with 100 µg/ml adenine added. Scale bar corresponds to 2 mm. (G) Colony morphologies on SD medium without or with 100 µg/ml adenine added. Scale bar corresponds to 2 mm.
Figure 6
Figure 6. The set3Δ/Δ and hos2Δ/Δ cells have a hyperactive cAMP/PKA pathway.
(A) Simplified scheme of signaling pathways converging at Efg1. Dashed lines indicate implied or indirect connections. (B) Western blot analysis of phosphorylated MAP kinases. Deletion of SET3 is associated with increased level of phosphorylated Mkc1, indicating active PKC signaling (compare lanes 8 and 11). The antibody also recognizes phosphorylated Cek1, the upstream MAP kinase of Cph1 . (C) Colony morphologies of mutant strains with the indicated genotypes. SET3 is epistatic to MKC1, TPK1 and TPK2 but hypostatic to CDC35. Images were taken after three days of incubation except for the cdc35Δ/Δ and cdc35Δ/Δ set3Δ/Δ strains, which were incubated for four days. FCS stands for YPD supplemented with 10% fetal calf serum. Scale bar corresponds to 2 mm. (D) Trehalose content of colonies grown on YPD at 37°C (left panel). Although the total colonies have similar trehalose levels, the hyphal fraction of the set3Δ/Δ cells contains about 4-times less trehalose as the yeast fraction, indicating a history of elevated PKA activity. When grown on plates supplemented with FCS at 37°C (right panel), set3Δ/Δ colonies contain about 3-times less trehalose than wild type or set3Δ/Δ::SET3 colonies. Moreover, all filamentous fractions contain about 4-times less trehalose than the corresponding yeast fractions, indicating a history of elevated PKA activity. “T”: total, “Y”: yeast, “H”: hyphal fraction. Data are displayed as mean + SD of three independent experiments. Asterisk indicates statistical significance of P<0.05 (Student's t-test). (E) Protein kinase A activities of cell extracts derived from the indicated colonies. Data are normalized against the activity level of wild type extracts, and are displayed as mean + SD of three independent experiments. “T”: total, “Y”: yeast, “H”: hyphal fraction. Asterisk indicates statistical significance of P<0.05 (Student's t-test). (F) Colony morphologies. Exogenous cAMP rescues the sensitized morphogenetic potential of set3Δ/Δ cells in the presence of adenine. Cultures were grown for 5 days at 37°C on SD medium. Scale bar corresponds to 2 mm.
Figure 7
Figure 7. Hyperfilamentation of set3Δ/Δ is reverted by non-fermentable carbon sources.
Colony morphologies on YP medium supplemented with 2% of the indicated carbon sources. set3Δ/Δ display wild type morphology on media containing non-fermentable carbon sources. Since Candida spp. do not have a β-lactamase, the cells fail to convert raffinose into fermentable monosaccharides. “F:” fermentable, “NF”: non-fermentable. Cultures were grown for 3 days at 37°C. Scale bar corresponds to 2 mm.
Figure 8
Figure 8. set3Δ/Δ cells are a hyperreactive to cAMP/PKA induction by GlcNAc.
(A) Colony morphologies of wild type and set3Δ/Δ cells grown on YPD at 30°C for 3 days in the presence of the indicated amounts of N-acetylglucosamine (GlcNAc). Scale bar corresponds to 2 mm. (B) The “threshold shift” model for Set3C function in triggering morphogenesis. The cAMP/PKA signaling pathway transmits environmental information, thereby shaping the morphogenetic change. In wild type cells (left panel), the sensitivity of the pathway to adequate signals is antagonized by the SetC. If the Set3C is disrupted or impaired (right panel), the threshold for morphogenetic conversion is shifted, and the pathway responds to milder inducing stimuli by triggering filamentation. In addition, metabolites such as adenine also modulates the activity of the pathway through as yet undisclosed mechanisms.
Figure 9
Figure 9. The set3Δ/Δ mutant shows attenuated virulence in a murine infection model.
(A) Kaplan-Meier survival curves of mice receiving tail vein injections of MTL a/α wild type, set3Δ/Δ and set3Δ/Δ::SET3 C. albicans strains. Ten mice per C. albicans genotype were injected; survival was monitored over three weeks. Statistical significance was determined using the Log-rank test. (B) set3Δ/Δ strains do not have a growth defect in vitro. Generation times of wild type and set3Δ/Δ cells were measured in YPD medium at 30°C as described in Materials and Methods. (C) Histopathology of the cortical part of kidneys of mice infected with wild type or set3Δ/Δ C. albicans strains on day one after infection. The set3Δ/Δ displays hyperfilamentous growth. Tissues were stained with Grocott staining to visualize fungal cells. Counterstaining was performed with Hematoxilin.

Similar articles

Cited by

References

    1. Odds FC. London: Baillière Tindall; 1988. Candida and Candidosis: A Review and Bibliography.
    1. Rooney PJ, Klein BS. Linking fungal morphogenesis with virulence. Cell Microbiol. 2002;4:127–137. - PubMed
    1. Gow NA, Brown AJ, Odds FC. Fungal morphogenesis and host invasion. Curr Opin Microbiol. 2002;5:366–371. - PubMed
    1. Brown AJ, Gow NA. Regulatory networks controlling Candida albicans morphogenesis. Trends Microbiol. 1999;7:333–338. - PubMed
    1. Ernst JF. Transcription factors in Candida albicans - environmental control of morphogenesis. Microbiology. 2000;146 (Pt8):1763–1774. - PubMed

Publication types

MeSH terms