Differing mechanisms underlie sexual size-dimorphism in two populations of a sex-changing fish
- PMID: 20485547
- PMCID: PMC2868897
- DOI: 10.1371/journal.pone.0010616
Differing mechanisms underlie sexual size-dimorphism in two populations of a sex-changing fish
Abstract
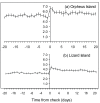
Variability in the density of groups within a patchy environment lead to differences in interaction rates, growth dynamics and social organization. In protogynous hermaphrodites there are hypothesised trade-offs among sex-specific growth, reproductive output and mortality. When differences in density lead to changes to social organization the link between growth and the timing of sex-change is predicted to change. The present study explores this prediction by comparing the social organisation and sex-specific growth of two populations of a protogynous tropical wrasse, Halichoeres miniatus, which differ in density. At a low density population a strict harem structure was found, where males maintained a tight monopoly of access and spawning rights to females. In contrast, at a high density population a loosely organised system prevailed, where females could move throughout multiple male territories. Otolith microstructure revealed the species to be annual and deposit an otolith check associated with sex-change. Growth trajectories suggested that individuals that later became males in both populations underwent a growth acceleration at sex-change. Moreover, in the high density population, individuals that later became males were those individuals that had the largest otolith size at hatching and consistently deposited larger increments throughout early larval, juvenile and female life. This study demonstrates that previous growth history and growth rate changes associated with sex change can be responsible for the sexual dimorphism typically found in sex-changing species, and that the relative importance of these may be socially constrained.
Conflict of interest statement
Figures


Similar articles
-
Faster juvenile growth promotes earlier sex change in a protandrous hermaphrodite (barramundi Lates calcarifer).Sci Rep. 2021 Jan 26;11(1):2276. doi: 10.1038/s41598-021-81727-1. Sci Rep. 2021. PMID: 33500452 Free PMC article.
-
Size-selective harvesting alters life histories of a temperate sex-changing fish.Ecol Appl. 2007 Dec;17(8):2268-80. doi: 10.1890/06-1930.1. Ecol Appl. 2007. PMID: 18213967
-
Influence of protogynous sex change on recovery of fish populations within marine protected areas.Ecol Appl. 2020 Apr;30(3):e02070. doi: 10.1002/eap.2070. Epub 2020 Feb 3. Ecol Appl. 2020. PMID: 31903628
-
Age determination and longevity in fishes.Gerontology. 1994;40(2-4):70-96. doi: 10.1159/000213580. Gerontology. 1994. PMID: 7926859 Review.
-
Early-life food stress hits females harder than males in insects: A meta-analysis of sex differences in environmental sensitivity.Ecol Lett. 2023 Aug;26(8):1419-1431. doi: 10.1111/ele.14241. Epub 2023 May 10. Ecol Lett. 2023. PMID: 37162027 Review.
Cited by
-
Spawning aggregation behavior and reproductive ecology of the giant bumphead parrotfish, Bolbometopon muricatum, in a remote marine reserve.PeerJ. 2014 Nov 25;2:e681. doi: 10.7717/peerj.681. eCollection 2014. PeerJ. 2014. PMID: 25469322 Free PMC article.
-
Mapping of DNA sex-specific markers and genes related to sex differentiation in turbot (Scophthalmus maximus).Mar Biotechnol (NY). 2012 Oct;14(5):655-63. doi: 10.1007/s10126-012-9451-6. Epub 2012 May 3. Mar Biotechnol (NY). 2012. PMID: 22552957
-
Protogyny in a tropical damselfish: females queue for future benefit.PeerJ. 2016 Jun 30;4:e2198. doi: 10.7717/peerj.2198. eCollection 2016. PeerJ. 2016. PMID: 27413641 Free PMC article.
-
Not all offspring are created equal: variation in larval characteristics in a serially spawning damselfish.PLoS One. 2012;7(11):e48525. doi: 10.1371/journal.pone.0048525. Epub 2012 Nov 14. PLoS One. 2012. PMID: 23155389 Free PMC article.
References
-
- Charnov EL. Princeton University Press; 1982. The theory of sex allocation. Princeton. - PubMed
-
- Iwasa Y. Sex change evolution and cost of reproduction. Behav Ecol. 1991;2:56–68.
-
- Munday PL, Buston PM, Warner RR. Diversity and flexibility of sex-change strategies in animals. Trends Ecol Evol. 2006a;21:89–95. - PubMed
-
- Buston P. Size and growth modification in clownfish. Nature. 2003;424:145–146. - PubMed
Publication types
MeSH terms
LinkOut - more resources
Full Text Sources

