. 2010 May 13;6(5):e1000785.
doi: 10.1371/journal.pcbi.1000785.

A model for genetic and epigenetic regulatory networks identifies rare pathways for transcription factor induced pluripotency

Affiliations

A model for genetic and epigenetic regulatory networks identifies rare pathways for transcription factor induced pluripotency

Maxim N Artyomov et al. PLoS Comput Biol. .

Abstract

With relatively low efficiency, differentiated cells can be reprogrammed to a pluripotent state by ectopic expression of a few transcription factors. An understanding of the mechanisms that underlie data emerging from such experiments can help design optimal strategies for creating pluripotent cells for patient-specific regenerative medicine. We have developed a computational model for the architecture of the epigenetic and genetic regulatory networks which describes transformations resulting from expression of reprogramming factors. Importantly, our studies identify the rare temporal pathways that result in induced pluripotent cells. Further experimental tests of predictions emerging from our model should lead to fundamental advances in our understanding of how cellular identity is maintained and transformed.


Conflict of interest statement

The authors have declared that no competing interests exist.

Figures

Figure 1
Figure 1. Specification of the genetic and epigenetic states that describe cellular states.
(a) Only the master-regulatory genes that govern cell state are arranged in a hierarchy (house keeping, stress-response and many other genes are not considered). Each node of the hierarchy represents an ensemble of master-regulatory genes that govern a particular cellular state. For example, genes in the top node are known master-regulators of the embryonic stem cell state (e.g. Oct4, Sox2, Nanog). When a cell is in the ES state, only these three genes will be expressed while other genes will not. Similarly, when a cell is fully differentiated, genes in one of the bottom modules will be expressed but not any other gene in the network. Each master-regulatory ensemble can contain many genes, only three are shown in each node. Green and blue balls above the links indicate that not only master regulatory proteins but also other proteins such as chromatin modifiers and housekeeping genes mediate interactions between modules of master-regulators. (b) Fig. 1a has been coarse-grained such that only master-regulatory modules (nodes in fig. 1a) are shown. Cellular identity is determined by both epigenetic (chromatin marks, DNA methylation) and genetic (expression profile) states. Examples of two states (ES state and “left” pluripotent progenitor) are shown. For each example, two lattices are needed to describe the state of gene expression and the epigenome: top lattice reflects the expression levels of master-regulatory proteins in the ES/progenitor state and bottom lattice reflects the epigenetic state of master-regulatory genes in the ES/progenitor state.
Figure 2
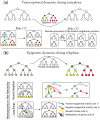
Figure 2. Simplified model for progression through the cell cycle.
The cell cycle is divided into two generalized phases: called interphase and telophase for simplicity. Gene expression occurs during the interphase, while cell division and associated processes occur in the telophase. In the interphase gene expression profile is governed by the stable epigenetic marks on the master-regulatory genes. In the telophase, however, protein environment can change the epigenetic marks of the master-regulaory genes, particularly when DNA is decondensing after cell division. Differentiation signals (newly expressed proteins) determine future epigenetic marks created during telophase due to the action of the new protein environment. The color code representing genetic and epigenetic states is the same as in Fig. 1.
Figure 3
Figure 3. Rules that govern interactions within epigenetic and genetic networks.
(a) During interphase, gene expression profiles of master-regulatory modules are established. Gene expression is influenced by epigenetic marking of the corresponding gene and interactions between expressed proteins. Two rules reflect this in our simulation: 1) when master-regulatory gene is in epigenetically marked positively, it favors expression of the corresponding protein; 2) when two (three) neighboring genes are in epigenetically open states, they all favor expression of corresponding proteins, but due to their mutually repressive action (see text) only one of two(three) genes are expressed. Which gene is expressed is chosen stochastically. (b) During the telophase, the protein environment can alter the epigenetic marks on the master-regulatory genes. Epigenetic marks on both neighboring and distant genes in the hierarchy can be altered. Long-range effect is typically mediated through DNA methylation which epigenetically silences all of the master-regulatory genes of unrelated lineages and also ancestral states (see text). Short-range interactions affect nearest-neighbors differentially: progenies master-regulatory genes are preferentially put into bivalent states while progenitor and competing lineage modules are epigenetically silenced. The color code representing genetic and epigenetic states is the same as in Fig. 1. The numbers corresponding to the rules are the same as in text and Table 1.
Figure 4
Figure 4. Changing cellular identity during self-initiated differentiation of the ES cell-state.
Process begins with cell division where regulatory modules of progenies are put into epigenetically open states. In phase 2 only one of the three neighboring proteins can be actually expressed in accord with Fig. 3a. Thus, one of three possibilities is realized: self-renewal, and differentiation to the “left” or “right” lineages. In the absence of external stimuli, in our simulations, there is an equal chance to observe each outcome. Simulations are performed with parameter values F = 2000; J = 3000; G = 25; H = 40; a = 0; b = 0.3. The color code representing genetic and epigenetic states is the same as in Fig. 1.
Figure 5
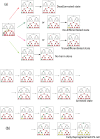
Figure 5. Reprogramming is a consequence of random perturbation of epigenetic state of the cell.
In our model, reprogramming factors can change the epigenetic state of randomly chosen regulatory modules (for reasons, see text). (a) Starting from a fully differentiated state, reprogramming factors can perturb any of the remaining 14 positions (for the case of a 4-level hierarchy). Four outcomes are possible depending on the perturbation site: death/arrest, trans-differentiation, de-differentiation or return to the initial cellular state. These outcomes are determined by simulating the system in accord with the rules described in the text and Figs. 2–3. The color code representing genetic and epigenetic states is the same as in Fig. 1 (b) Examples of real trajectories observed in simulations illustrating different temporal evolution of epigenetic and genetic states. Complete cell reprogramming appears as a consequence of several successful de-differentiation events as seen in the second example trajectory. Simulations are performed with parameter values F = 2000; J = 3000; G = 25; H = 40; a = 0; b = 0.3. The color code representing genetic and epigenetic states is the same as in Fig. 1.
Figure 6
Figure 6. Simulations of a model where each gene module regulating a cellular identity consists of three different genes.
(a) In this (similar to the previous) model, individual genes do not interact with each other. Rather modules interact with each other when all of the proteins in a module are expressed. Since reprogramming factors change the epigenetic state of randomly chosen individual genes, several (here: at least three) genes have to be changed to open chromatin status at the same time in order to allow a whole module to be able to express proteins. Examples of simulated trajectories show activation of genes of unrelated lineages during successful reprogramming. Simulations are performed with parameter values F = 2000; J = 3000; G = 25; H = 40; a = 0; b = 0.3. (b) If population averaged expressions of genes during reprogramming can be measured, one can compute a 4-point correlation function (see Eq. 1). This correlation function describes the probability of activation of a given gene after the master regulatory gene module, i, was silenced. Then all the genes can be grouped in three groups as our simulation indicates. Thus, the genes defining the most likely paths to reprogramming can be identified as the ones with the highest magnitude of this correlation function. The correlation function was computed by averaging over all successfully reprogrammed trajectories. The colors correspond to the magnitude of the correlation function (as shown on the left).
Figure 7
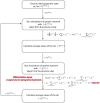
Figure 7. Flow chart of the simulation procedure.
The simulation essentially mimics progression through the cell cycle in accord with Fig. 2. In each phase of the cell cycle, interactions within and between genetic and epigenetic lattices are enforced through the Hamiltonians of Eq. 2 and 3. Mathematical structure and choice of parameters are such that rules depicted in Fig. 3 are obeyed. For analysis of sensitivity to parameter variations see Text S1.

Similar articles

Cited by

References

    1. Aoi T, Yae K, Nakagawa M, Ichisaka T, Okita K, et al. Generation of pluripotent stem cells from adult mouse liver and stomach cells. Science. 2008;321:699–702. - PubMed
    1. Jaenisch R, Young R. Stem cells, the molecular circuitry of pluripotency and nuclear reprogramming. Cell. 2008;132:567–582. - PMC - PubMed
    1. Meissner A, Wernig M, Jaenisch R. Direct reprogramming of genetically unmodified fibroblasts into pluripotent stem cells. Nat Biotechnol. 2007;25:1177–1181. - PubMed
    1. Park IH, Zhao R, West JA, Yabuuchi A, Huo HG, et al. Reprogramming of human somatic cells to pluripotency with defined factors. Nature. 2008;451:141–U141. - PubMed
    1. Takahashi K, Tanabe K, Ohnuki M, Narita M, Ichisaka T, et al. Induction of pluripotent stem cells from adult human fibroblasts by defined factors. Cell. 2007;131:861–872. - PubMed

Publication types

Substances