. 2010 May 12;5(5):e10597.
doi: 10.1371/journal.pone.0010597.

Roles of AP-2 in clathrin-mediated endocytosis

Affiliations

Roles of AP-2 in clathrin-mediated endocytosis

Emmanuel Boucrot et al. PLoS One. .

Abstract

Background: The notion that AP-2 clathrin adaptor is an essential component of an endocytic clathrin coat appears to conflict with recent observations that substantial AP-2 depletion, using RNA interference with synthesis of AP-2 subunits, fails to block uptake of certain ligands known to internalize through a clathrin-based pathway.

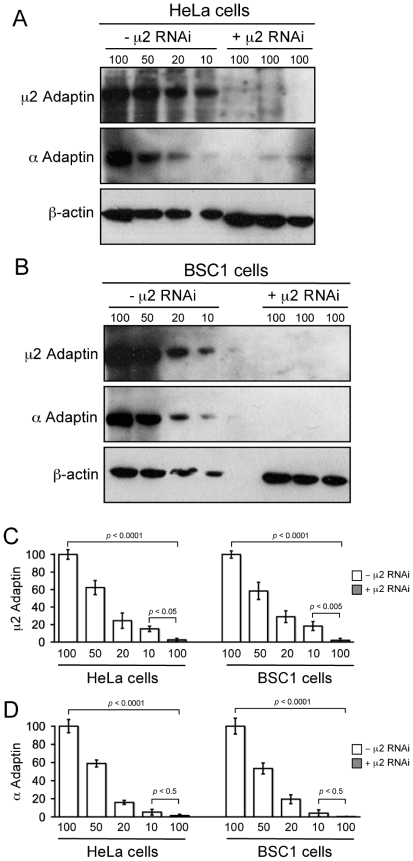
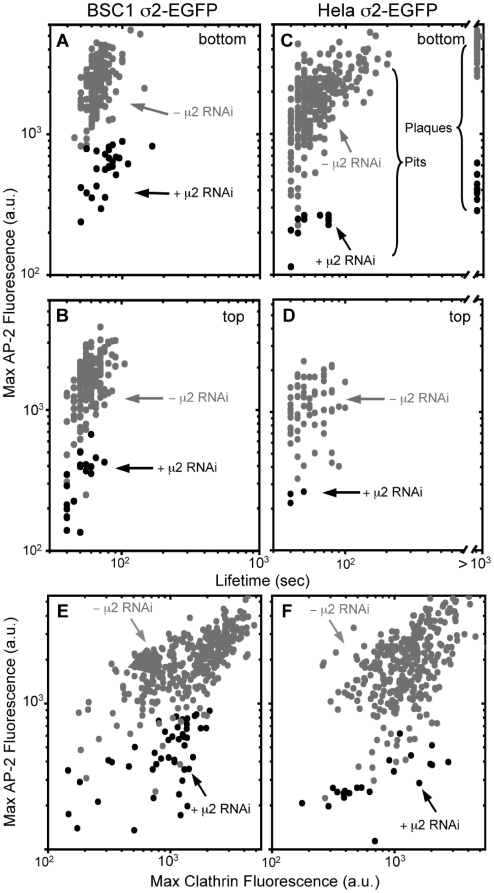
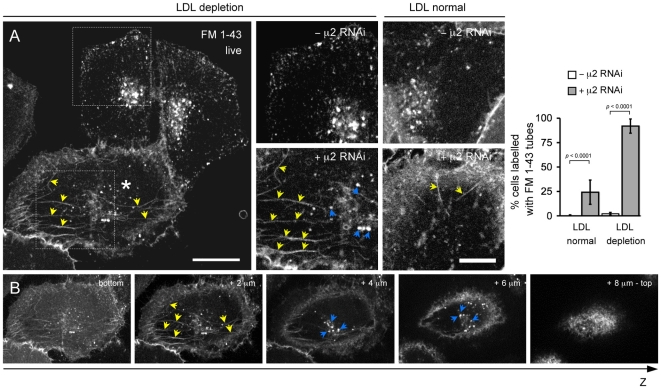
Methodology/principal findings: We report here the use of in vivo imaging data obtained by spinning-disk confocal microscopy to study the formation of clathrin-coated structures at the plasma membranes of BSC1 and HeLa cells depleted by RNAi of the clathrin adaptor, AP-2. Very few clathrin coats continue to assemble after AP-2 knockdown. Moreover, there is a total absence of clathrin-containing structures completely lacking AP-2 while all the remaining coats still contain a small amount of AP-2. These observations suggest that AP-2 is essential for endocytic coated-pit and coated-vesicle formation. We also find that AP-2 knockdown strongly inhibits light-density lipoprotein (LDL) receptor-mediated endocytosis, as long as cells are maintained in complete serum and at 37 degrees C. If cells are first incubated with LDL at 4 degrees C, followed by warming, there is little or no decrease in LDL uptake with respect to control cells. LDL uptake at 37 degrees C is also not affected in AP-2 depleted cells first deprived of LDL by incubation with either serum-starved or LDL-starved cells for 24 hr. The LDL-deprived cells display a significant increase in endocytic structures enriched on deeply invaginated tubes that contain LDL and we suggest that under this condition of stress, LDL might enter through this alternative pathway.

Conclusions/significance: These results suggest that AP-2 is essential for endocytic clathrin coated-pit and coated-vesicle formation. They also indicate that under normal conditions, functional endocytic clathrin coated pits are required for LDL internalization. We also show that under certain conditions of stress, cells can upregulate alternative endocytic structures with the potential to provide compensatory trafficking pathways.


Conflict of interest statement

Competing Interests: The authors have declared that no competing interests exist.

Figures

Figure 1
Figure 1. RNAi Depletion of AP-2.
(A, B) Immunoblots of cell extracts from HeLa or BSC1 cells treated with for 72 h in presence or absence of μ2- siRNA oligos and probed with antibodies specific for μ2-adaptin, α-adaptin or β-actin (used as loading control). Serial dilutions (30 µl (100%), 15 µl (50%), 6 µl (20%) and 3 µl (10%)) of the control cell extracts were processed for western blots; 30 µl (100%) were used for 3 independent μ2-RNAi cell extracts. (C,D) Residual μ2-adaptin and α-adaptin in each cell type, obtained from three independent RNAi experiments. Each band was background-corrected, normalized to the corresponding intensity of the actin band, then expressed as percent of its value with respect to the 100% loading.
Figure 2
Figure 2. Effect of AP-2 depletion on the surface distribution of AP-2 and on the uptake of transferrin.
(A, B) Control (-μ2 RNAi) and treated (+ μ2 RNAi) HeLa and BSC1 cells stably expressing σ2-EGFP were incubated at 37°C with 10 µg/ml of Tf-A594 for 10 min, followed by a quick rinse at 4°C to remove unbound transferrin, fixed with 3.7% PFA, and imaged in 3D with wide-field illumination. Representative views of the plane closest to the coverslip (σ2-EGFP) and of an equatorial plane (Tf) show a decrease in punctate σ2-EGFP signals at the cell membrane and inhibition of transferrin uptake. Insets correspond to representative boxed regions. Arrowheads mark the few remaining AP-2 spots in Tf-negative cells. Bar, 20 µm. (C, D) Histrograms showing the amount, relative to controls, of internalized transferrin obtained from the total fluorescence signal of Tf-A594 in the 3D stacks. The remaining signals were 11.9±6.9% (p<0.0001, 10 control and 14 AP-2 depleted HeLa cells) and 15.8±2.5% (p<0.0001, 15 control and 22 AP-2 depleted BSC1 cells), respectively.
Figure 3
Figure 3. Effect of AP-2 depletion on the formation of clathrin-coated structures at the plasma membrane of BSC1 cells.
(A) Time-series acquired with a spinning disk confocal microscope. The fluorescent assemblies were tagged with transiently expressed clathrin Tomato-LCa and with stably expressed AP-2 σ2-EGFP in the presence or absence of μ2-siRNA. The left hand panels at the left correspond to central optical sections of cells incubated with 10 µg/ml Tf-A647 for 10 min at 37°C. They show accumulation of Tf in endosomal structures in the control cells and Tf on the plasma membrane in AP-2 depleted cells (Bar, 10 µm). The central panels are snapshots and the right panels are kymographs from representative time series recorded every 2 s (500 ms exposures) for 360 s from the adherent (bottom) surface of the cells. The majority of the structures are dynamic and relatively short lived in control cells; their number and their clathrin and AP-2 content are greatly decreased in AP-2 depleted cells. (B) Transferrin (Tf) uptake in AP-2 depleted cells. The amount (in fluorescence arbitrary units) of internalized transferrin in each cell was obtained at the end of the time series from the total fluorescence signal of Tf-A647 in a 3D stack (see Methods). Tf uptake decreased to 7.8±6.4% of its control value (p<0.0001, from 3 control and 3 AP-2 depleted cells). (C) Nucleation rate (normalized to control levels) of clathrin-coated pits and vesicles (CCP) tagged with Tomato-LCa forming at the adherent (bottom) surface of BSC1 cells in the absence and presence of μ2-siRNA. The actual nucleation rate drop from 3.9±0.2 to 0.6±0.1 coated pits per 104 µm2.s−1 in cells depleted of AP-2 (p<0.0001; 4 controls and 4 AP-2 depleted cells). (D) Fluorescence intensity profiles of an individual clathrin coat tagged with clathrin Tomato-LCa and AP-2 σ2-EGFP forming in the presence (+ μ2-RNAi) and absence (- μ2-RNAi) of μ2-siRNA. (E) Average fluorescence intensity profiles of 60 clathrin coats tagged with clathrin Tomato-LCa and AP-2 σ2-EGFP forming in 3 cells depleted of AP-2 (+ μ2 RNAi) relative to 185 coats in 3 control cells (- μ2 RNAi). These cells expressed comparable amounts of clathrin tagged with Tomato-LCa as judged by the similarity in clathrin fluorescence determined associated with their perinuclear regions. All structures forming in AP-2 depleted cells contain statistically lower amounts of clathrin and AP-2 (p<0.0001; see details in Figure 4).
Figure 4
Figure 4. Effect of AP-2 depletion on sizes and lifetimes of clathrin-coats forming at the cell surface.
The double logarithmic plots show the maximum fluorescence intensity (prior to dissolution) and the lifetimes of every fluorescent spot containing clathrin and AP-2 recorded at the adhered (bottom) or free (top) plasma membrane of BSC1 and HeLa cells stably expressing AP-2 σ2-EGFP together with transient expression of Clathrin Tomato-LCa. The spots are color-coded to distinguish the effect of AP-2 depletion by the presence for 96 hr of siRNA specific for μ2-adaptin (black; +μ2 RNAi) from those in the absence of siRNA (gray; -μ2 RNAi) on the properties of endocytic clathrin coats. The data derive from time series of 1000 s duration recorded every 5 s (100 ms exposures) at 37°C acquired from three different cells for each category. The data was acquired using a spinning disk confocal microscope. (AD) Effect of AP-2 depletion on the content of AP-2 and the lifetimes of endocytic clathrin coated structures. (A, B) Maximum fluorescence intensity of AP-2 in clathrin-coated structures are 2491±842 (n = 186) and 1692±645 (n = 150) in the bottom and top of three control BSC1 cells and 600±182 (n = 25) and 330±141 (n = 18) in the corresponding surfaces of three AP-2 depleted cells. Their lifetimes are 67±12 and 60±11 s for control cells, and 79±20 and 51±11 s for AP-2 depleted cells, respectively. (C, D) Maximum fluorescence intensity of AP-2 in clathrin-coated structures are 1906±873 (n = 296) and 1118±472 (n = 67) in the bottom and top of three control HeLa cells and 231±42 (n = 11) and 247±24 (n = 3) in the corresponding surfaces of AP-2 depleted cells. Their life times are 66±28 and 44±6 s for control cells, and 59±15 and 44±6 s for three AP-2 depleted cells. In each case, the difference in maximum fluorescence intensity is statistically significant smaller in AP-2 depleted cells (p<0.0001). (E) Effect of AP-2 depletion in the content of clathrin Tomato-LCa and AP-2 σ2-EGFP in each of the endocytic clathrin coated structures of BSC1 cells shown in panels A and B. The maximum fluorescence intensities are 1789±1008 (n = 336) and 1020±489 (n = 43) for clathrin and 2134±857 and 486±212 for AP-2 in control and AP-2 depleted BSC1 cells, respectively. In all cases, the decrease in the number of coated structures and the fluorescence intensity due to AP-2 depletion is statistically significant (p<0.0001). (F) Effect of AP-2 depletion in the content of clathrin Tomato-LCa and AP-2 σ2-EGFP in each of the endocytic clathrin coated structures of HeLa cells shown in panels C and D. The maximum fluorescence intensities are 1326±686 (n = 363) and 422±146 (n = 14) for clathrin and 1906±874 and 231±43 for AP-2 in control and AP-2 depleted HeLa cells, respectively. In all cases, the decrease in the number of coated structures and the fluorescence intensity due to AP-2 depletion is statistically significant (p<0.0001).
Figure 5
Figure 5. Effect of LDL or serum starvation and of low temperature on the inhibition of LDL uptake in cells depleted of AP-2.
Fluorescent 3D image stacks spanning the complete cell were obtained with a spinning disk confocal microscope; the middle plane is shown as a reference. Bar, 20 µm. Insets correspond to representative boxed regions from AP-2 depleted cells. In each experiment shown, control (- μ2-RNAi) and AP-2 depleted (+ μ2-RNAi) cells were incubated for 10 min at 37°C with ligands specific for the experiment as listed below, quickly washed at 4°C to remove unbound ligands, and fixed (see Methods). Histograms show uptake of Tf and LDL (or CD8-LRLR in panel A) from 20 control cells (white bars) and 20 AP-2 depleted cells (gray bars), in 3 independent experiments. (A) HeLa cells stably expressing CD8-LDLR. The 10 min incubation included 10 µg/ml Tf-A594 and a monoclonal antibody specific for the ectodomain of human CD8. The reduction in uptake is from 100 to 15.4±5.0 and to 16.7±4.5 a.u. for Tf and CD8-LDL, respectively (p<0.0001 in both cases). (B) BSC1 cells. The 10 min incubation included 10 µg/ml Tf-A594 and 0.72 µg/ml LDL-Cy5. The reduction in uptake is from 100 to 15.8±5.6 and to 14.6±6.8 a.u. for Tf and LDL, respectively (p<0.0001 in both cases). (C) HeLa cells. The 10 min incubation included 10 µg/ml Tf-A594 and 0.72 µg/ml LDL-Cy5. The reduction in uptake is from 100 to 11.9±6.9 and 18.9±6.1 a.u. for Tf and LDL, respectively (p<0.0001 in both cases). (D) HeLa cells, preincubated for 1 h at 4°C with 10 µg/ml Tf-A594 and 0.72 µg/ml LDL-Cy5, then transferred to 37°C for 10 min. The reduction in Tf uptake is from 100 to 18.7±9.9 a.u. (p<0.0001); there is no reduction in LDL uptake (110.7±17.4, p>0.05). (E) HeLa cells, preincubated for 24 h in medium supplemented with LDL-deficient serum, then for 10 min (at 37°C) with 10 µg/ml Tf-A594 and 0.72 µg/ml LDL-Cy5. The reduction in Tf uptake is from 100 to 17.2±10.7 a.u. (p<0.0001); there is no reduction in LDL uptake (103±23.9, p>0.05). (F) HeLa cells, preincubated for 6 h in serum-depleted medium (0.1% serum), then for 10 min (at 37°C) in normal medium with 10 µg/ml Tf-A594 and 0.72 µg/ml LDL-Cy5. The reduction in Tf uptake is from 100 to 14.6±11.3 a.u. (p<0.0001); there is no reduction in LDL uptake (98.0±22.0, p>0.05).
Figure 6
Figure 6. Enrichment of endocytic tubules labeled with FM 1-43 dye in HeLa cells depleted of AP-2 and LDL.
(A) Effect of AP-2 depletion on the enrichment of tubular structures labeled with FM 1-43 fluorescent dye. The experiment was carried out on a mixture of HeLa cells depleted (+ μ2 RNAi) or not (-μ2 RNAi) of AP-2 by treatment with RNAi specific for μ2. Cells were imaged 24 hrs after plating in medium supplemented with 10% FCS (LDL normal) or with LDL-depleted serum (LDL depletion) using a spinning-disk confocal microscope. Cells depleted of AP-2 (marked with an asterisk ‘*’) were identified by the lack of internalized fluorescent Tf following a brief incubation for 5 min with 10 µg/ml Tf-A594 (not shown). Cells were then incubated with 5 µg/ml FM 1-43 for 5 min and imaged live. Yellow arrows in the inset highlight the appearance in the AP-2 depleted cell of tubular structures containing FM 1-43. Blue arrows in the insets highlight spots corresponding to endosomes. Images are representative of 100 random cells analyzed acquired for each category from 3 independent experiments. Bar, 20 µm (10 µm in the insets). The histograms show the fraction of cells containing tubes labeled with FM 1-43 observed in 100 Tf-negative cells selected randomly from the imaging fields. Data for each category were obtained from 3 experiments performed independently. Similar results were obtained using BSC1 cells (not shown). (B) Images from a Z-stack of consecutive optical planes acquired every 0.3 µm. They highlight the presence of intracellular tubular structures labeled with the FM 1-43-dye (yellow arrows) added to the medium. The tubular structures are contained within the cellular boundaries and are therefore located inside the cell. The images also indicate the intracellular location of endosomal spots (blue arrows).
Figure 7
Figure 7. Enrichment of endocytic tubules labeled with LDL-Cy5 in HeLa cells depleted of AP-2 and LDL and their susceptibility to chemical fixation.
(A) HeLa cells depleted (+ μ2 RNAi) or not (-μ2 RNAi) of AP-2 by treatment with μ2 RNAi were plated and incubated for 24 hrs in medium containing LDL-deficient serum (LDL depletion). The samples were then incubated with 10 µg/ml Tf-A488 (to identify AP-2 depleted cells – not shown) and 0.72 µg/ml LDL-Cy5 for 5 min, followed by live-cell imaging with the spinning-disk confocal microscope (live). The cells were then fixed directly on the microscope stage using 3.7% PFA for 10 min and imaged again using the same exposure (fixed). Yellow arrows highlight the presence of tubular structures containing LDL-Cy5 in AP-2 depleted HeLa cells. Blue arrows highlight fluorescent spots due to the endosomal accumulation of LDL-Cy5. The tubular structures are labile, as documented by their almost complete disappearance following chemical fixation. Bar, 20 µm (10 µm in the insets). Images are representative of 100 random cells acquired for each category from 3 independent experiments. The histograms show the fraction of live cells containing tubes labeled with LDL-Cy5 observed in 100 Tf-negative cells selected randomly from the imaging fields. Data was obtained from 3 experiments performed independently. Similar results were obtained using BSC1 cells (not shown). (B) Images from a Z-stack acquired with 0.3 µm steps showed the intracellular localization of the LDL-Cy5-labelled tubes (yellow arrows) and the presence of spots (blue arrows) within the cells displayed on ‘+ μ2 RNAi, LDL depletion, live’ on panel A.

Similar articles

Cited by

References

    1. Kirchhausen T. Three ways to make a vesicle. Nat Rev Mol Cell Biol. 2000;1:187–198. - PubMed
    1. Schmid EM, McMahon HT. Integrating molecular and network biology to decode endocytosis. Nature. 2007;448:883–888. - PubMed
    1. Ehrlich M, Boll W, Van Oijen A, Hariharan R, Chandran K, et al. Endocytosis by random initiation and stabilization of clathrin-coated pits. Cell. 2004;118:591–605. - PubMed
    1. Saffarian S, Cocucci E, Kirchhausen T. Distinct dynamics of endocytic clathrin-coated pits and coated plaques. PLoS Biol. 2009;7:e1000191. - PMC - PubMed
    1. Motley A, Bright NA, Seaman MN, Robinson MS. Clathrin-mediated endocytosis in AP-2-depleted cells. J Cell Biol. 2003;162:909–918. - PMC - PubMed

Publication types