Comparative Study
. 2010 Aug;40(8):2319-29.
doi: 10.1002/eji.201040515.

The dynamic TCRδ: TCRδ chains in the amphibian Xenopus tropicalis utilize antibody-like V genes

Affiliations
Comparative Study

The dynamic TCRδ: TCRδ chains in the amphibian Xenopus tropicalis utilize antibody-like V genes

Zuly E Parra et al. Eur J Immunol. 2010 Aug.

Abstract

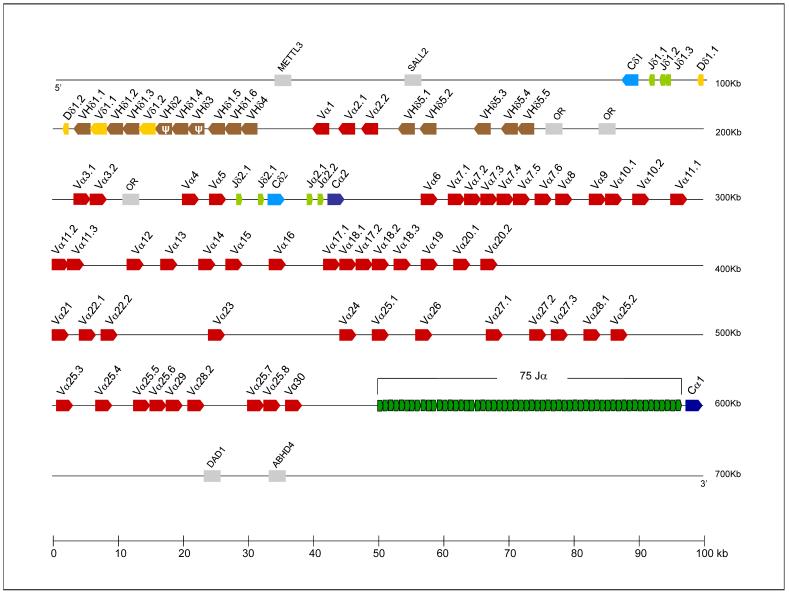
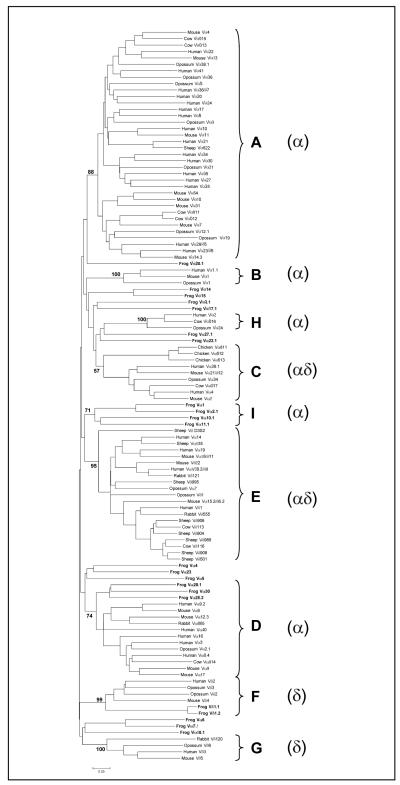
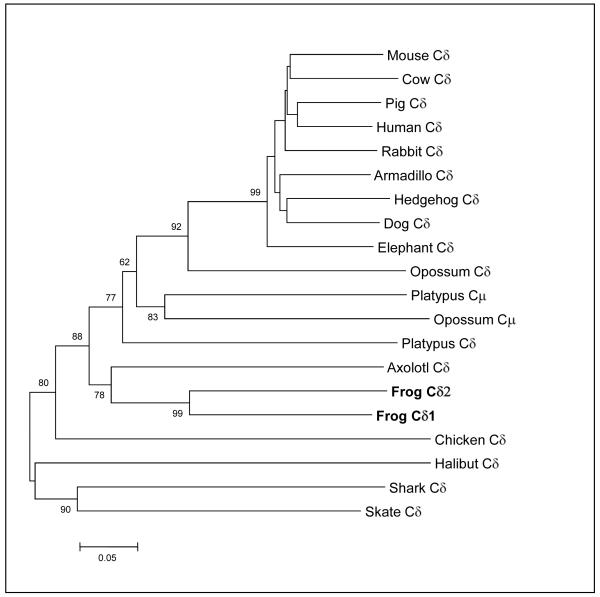
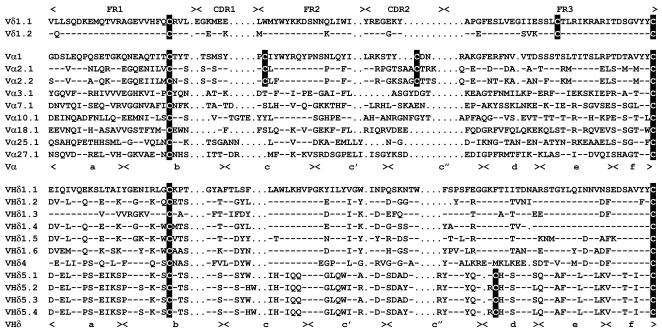
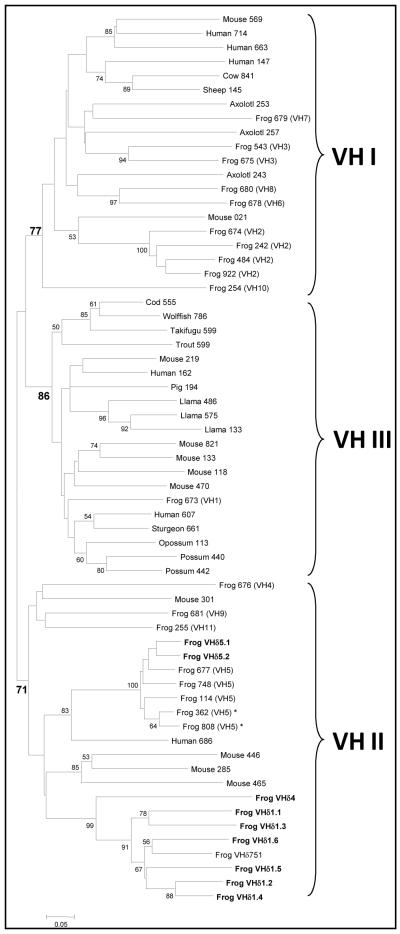
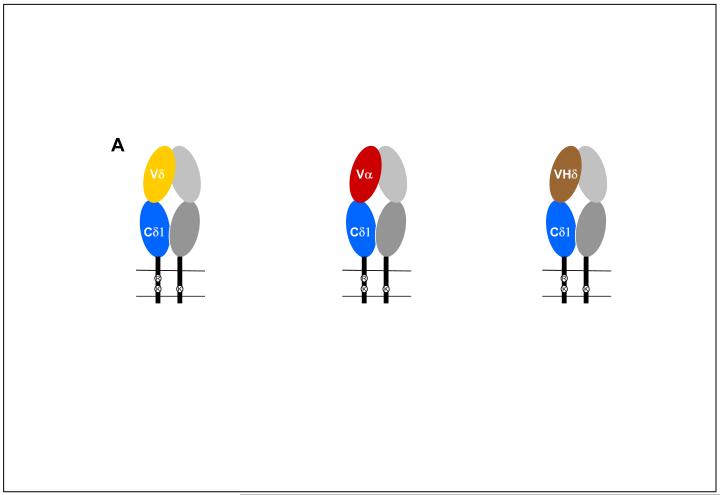
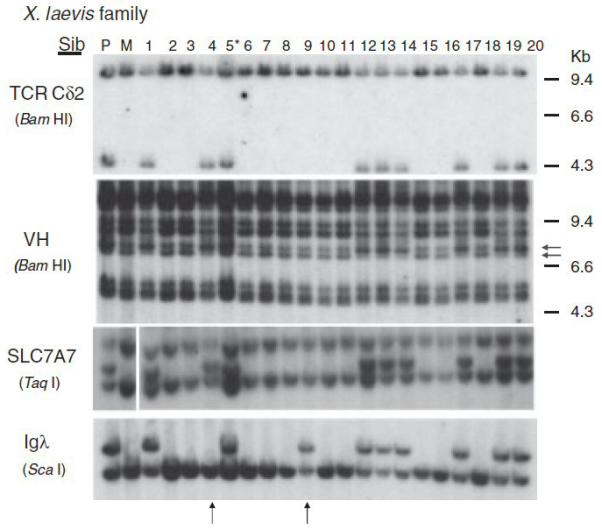
The content and organization of the Xenopus tropicalis TCRα/δ locus was determined. This locus is highly conserved among tetrapods, with the genes encoding the TCRδ chains embedded with those encoding TCRα. However, the frog TCRα/δ is unusual in that it contains V genes that appear indistinguishable from those in the IgH locus (VH). These V genes, termed VHδ, make up 70% of the V genes at the TCRδ locus and are expressed exclusively in TCRδ chains. Finding TCRδ chains that use antibody-like V domains in frogs is similar to the situation in shark TCRδ variants and TCRμ in marsupials. These results suggest that such unconventional TCR may be more widespread across vertebrate lineages than originally thought and raise the possibility of previously unrealized subsets of T cells. We also revealed close linkage of TCRα/δ, IgH, and Igλ in Xenopus which, in combination with linkage analyses in other species, is consistent with the previous models for the emergence of these antigen receptor loci.


Figures

Figure 1
Figure 1
Representation of the X. tropicalis TCRα/δ locus. TCR Vα (red), Vδ (yellow), VHδ (brown), Jδ (light green), Jα (dark green) and Dδ (orange) gene segments and two Cα (dark blue) and two Cδ (light blue) were numbered according to their position in the locus or to prior description. Transcriptional orientation is demonstrated by the direction of the arrow in each segment. Syntenic genes shown in gray are those conserved with mammalian TCRα/δ locus: methyl-transferase like 3 (METTL3), zinc finger protein (SALL2), olfactory receptors (OR), defender against cell death gene 1 (DAD1) and abhydrolase domain-containing protein 4 gene (ABHD4).
Figure 2
Figure 2
Phylogenetic tree of X. tropicalis Vα and Vδ compared to mammalian and avian genes using the neighbor joining method. Similar results were found using the minimum evolution method. X. tropicalis sequences are shown in bold. Vα and Vδ genes fall into nine groups that are indicated by brackets. Bootstrap values shown are based on 1000 replicates. A distance bar is shown below the tree.
Figure 3
Figure 3
Phylogenetic analyses of X. tropicalis TCRδ constant regions. The tree shown includes TCRμ sequences from platypus and opossum. Alignments were analyzed using the minimum evolution distance method. Similar results were found using the neighbor joining method. Bootstrap values shown are based on 1000 replicate samples. The distance bar is shown under the tree.
Figure 4
Figure 4
Alignment of predicted amino acid sequences of X. tropicalis Vδ, representative Vα and VHδ regions. Canonical cysteine residues involved in intrachain disulfide bonds and extra cysteine residues potentially used for interchain interactions are highlighted in black. Frameworks and complementarity determining regions are indicated above the alignment. β-strands are indicated under the alignment.
Figure 5
Figure 5
Phylogenetic tree showing the X. tropicalis VHδ gene segments compared to Ig VH gene segments from different species. X. tropicalis VHδ gene segments are indicated in bold. The VHδ pseudogenes, VHδ2 and VHδ3, are not included in this tree but cluster with VHδ1 and VHδ4 subgroups when included. Frog VH sequences indicated with an asterisk are those from X. tropicalis, with the remaining being from X. laevis. Three distinct VH clans are indicated by brackets. The tree was generated using the minimum evolution method. Similar results were found using the neighbor joining method. Numbers at the nodes are bootstrap values based on 1000 replicates. A distance bar is shown at the bottom of the tree.
Figure 6
Figure 6
A. Diagram of expressed isoforms of X. tropicalis Cδ1. B. CDR3 nucleotide alignment of representative sequences. Germline D sequences are labeled on top of the alignment. Vα, Vδ and VHδ gene segments are indicated on the left side and J gene segments on the right. Highlighted in gray is a five bp sequence present in both Dδ segments. Microhomologies in the germline and CDR3 regions are underlined; P and N nucleotides (shown in white letters) are highlighted in black and gray, respectively. GenBank accession numbers are shown in parenthesis on the right.
Figure 6
Figure 6
A. Diagram of expressed isoforms of X. tropicalis Cδ1. B. CDR3 nucleotide alignment of representative sequences. Germline D sequences are labeled on top of the alignment. Vα, Vδ and VHδ gene segments are indicated on the left side and J gene segments on the right. Highlighted in gray is a five bp sequence present in both Dδ segments. Microhomologies in the germline and CDR3 regions are underlined; P and N nucleotides (shown in white letters) are highlighted in black and gray, respectively. GenBank accession numbers are shown in parenthesis on the right.
Figure 7
Figure 7
The germline X. tropicalis Dδ gene segments. Highlighted in gray is a five bp sequence present in both Dδ segments. Reading frames and Recombination signal sequences of the two Dδ gene segments found recombined with Vα, Vδ and VHδ.
Figure 8
Figure 8
Close linkage of TCRα/δ, IgH, and Igλ loci in the Xenopus genome. Probes and restriction enzyme giving the RFLP are indicated on the left. Arrows on the right indicate polymorphic bands with VH that segregate with the bottom band of TCRδ. Arrows below indicate recombinants (siblings #4 & 9) between TCRδ and Igλ. Size markers are indicated on the right. The bands for SLC7A7 and Igλ are found between 2.3kb and 4.3kb marker bands. Sibling #5 (asterisk) is a natural triploid. P, paternal; M, maternal.

Similar articles

Cited by

References

    1. Davis MM, Chein YH. T cell antigen receptors. In: Paul WE, editor. Fundamental Immunology. 6th ed. Lippincott; Philadelphia: 2008. pp. 313–345.
    1. Saito T. T cell antigen receptor, structure, expression and function. Hum. Cell. 1990;3:183–192. - PubMed
    1. Litman GW, Anderson MK, Rast JP. Evolution of antigen binding receptors. Annu. Rev. Immunol. 1999;17:109–147. - PubMed
    1. Chien YH, Gascoigne NR, Kavaler J, Lee NE, Davis MM. Somatic recombination in a murine T-cell receptor gene. Nature. 1984;309:322–326. - PubMed
    1. Satyanarayana K, Hata S, Devlin P, Roncarolo MG, De Vries JE, Spits H, Strominger JL, Krangel MS. Genomic organization of the human T-cell antigen-receptor α/δ locus. Proc. Natl. Acad Sci. USA. 1988;85:8166–8170. - PMC - PubMed

Publication types

MeSH terms

LinkOut - more resources