. 2010 Jul;27(7):1283-95.
doi: 10.1089/neu.2009.1227.

Minozac treatment prevents increased seizure susceptibility in a mouse "two-hit" model of closed skull traumatic brain injury and electroconvulsive shock-induced seizures

Affiliations

Minozac treatment prevents increased seizure susceptibility in a mouse "two-hit" model of closed skull traumatic brain injury and electroconvulsive shock-induced seizures

MaryAnn Chrzaszcz et al. J Neurotrauma. 2010 Jul.

Abstract

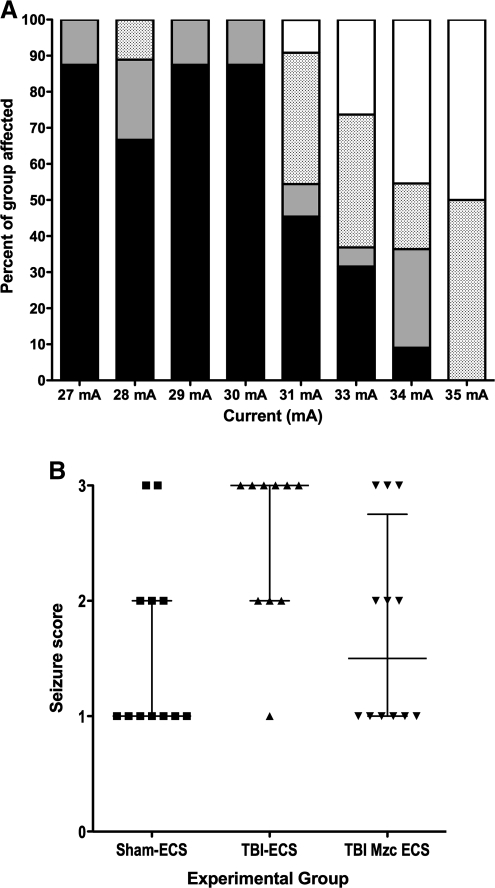
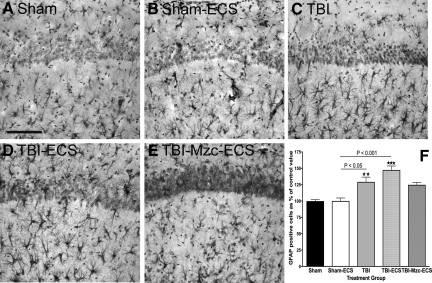
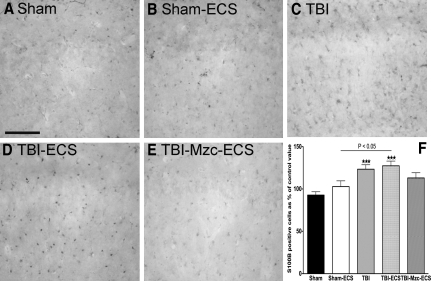
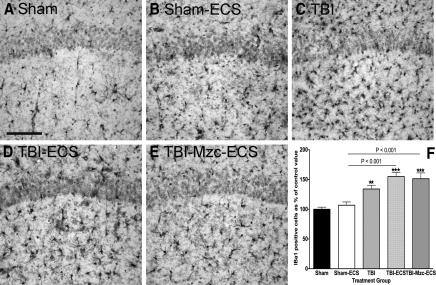
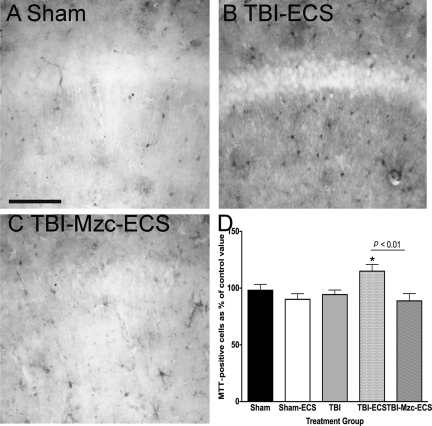
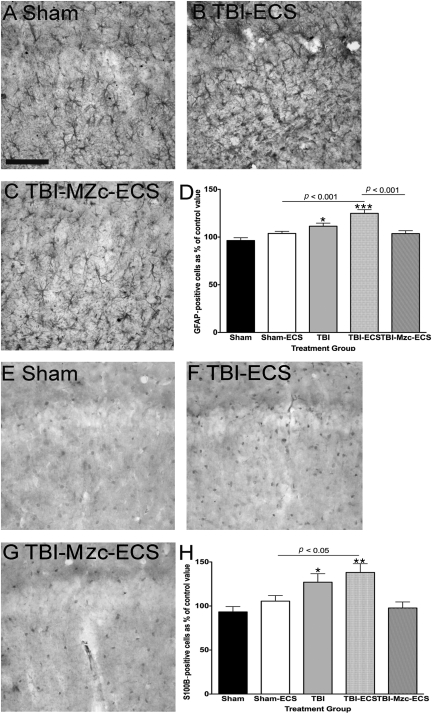
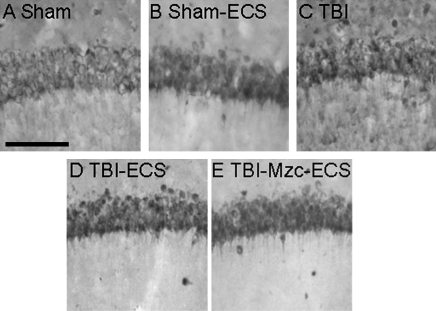
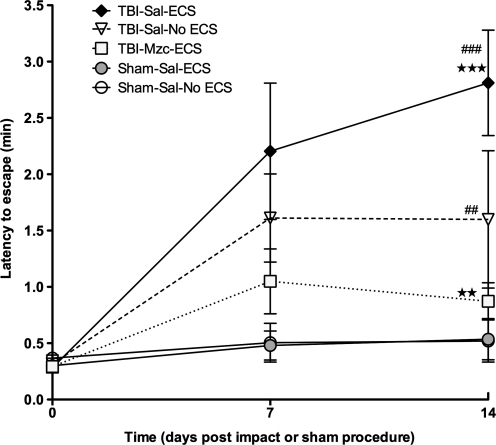
The mechanisms linking traumatic brain injury (TBI) to post-traumatic epilepsy (PTE) are not known and no therapy for prevention of PTE is available. We used a mouse closed-skull midline impact model to test the hypotheses that TBI increases susceptibility to seizures in a "two-hit" injury model, and that suppression of cytokine upregulation after the first hit will attenuate the increased susceptibility to the second neurological insult. Adult male CD-1 mice underwent midline closed skull pneumatic impact. At 3 and 6 h after impact or sham procedure, the mice were injected IP with either Minozac (Mzc), a suppressor of proinflammatory cytokine upregulation, or vehicle (saline). On day 7 after sham operation or TBI, seizures were induced using electroconvulsive shock (ECS), and susceptibility to seizures was measured by the current required for seizure induction. Activation of glia, neuronal injury, and metallothionein-immunoreactive cells were quantified in the hippocampus by immunohistochemical methods. Neurobehavioral function over 14-day recovery was quantified using the Barnes maze. Following TBI there was a significant increase in susceptibility to seizures induced by ECS, and this susceptibility was prevented by suppression of cytokine upregulation with Mzc. Astrocyte activation, metallothionein expression, and neurobehavioral impairment were also increased in the two-hit group subjected to combined TBI and ECS. These enhanced responses in the two-hit group were also prevented by suppression of proinflammatory cytokine upregulation with Mzc. These data implicate glial activation in the mechanisms of epileptogenesis after TBI, and identify a potential therapeutic approach to attenuate the delayed neurological sequelae of TBI.


Figures

FIG. 1.
FIG. 1.
(A) Stacked bar graph of responses to graded electroconvulsive shock (ECS) in naïve male CD1 mice. Mice were exposed to a single ECS in 1-mA increments from 27–35 mA (n = 8–19 per group). The response to ECS was videotaped and scored by separate observers as either no response (black), forelimb clonic seizure (grey), fore and hindlimb generalized tonic-clonic seizure (stippled), or death (white). The seizure threshold was determined to be 30 mA (χ2 p < 0.0001 for 30 mA versus 31 mA). (B) Scatterplot of seizure scores (1, no seizure; 2, decreased activity; 3 forelimb or hindlimb clonic seizure) following 30-mA ECS-induced seizure on day 7 after TBI (TBI-ECS), TBI treated with the small molecule Minozac (TBI-Mzc-ECS), or sham procedure (Sham-ECS; bars indicate median seizure score ± interquartile range). The seizure score was significantly increased in mice subjected to TBI prior to ECS compared to sham controls (Sham-ECS versus TBI-ECS, p < 0.05 by Kruskal-Wallis test). This increase in seizure susceptibility after TBI was prevented by treatment at 3 and 6 h with Mzc (Sham-ECS versus TBI-Mzc-ECS, not significant; n = 10–12 per group; TBI, traumatic brain injury).
FIG. 2.
FIG. 2.
Quantification of changes in the expression of the astrocyte marker glial fibrillary acidic protein (GFAP) in region CA1 of the hippocampus. All photomicrographs are of day 8 of recovery following sham procedure, traumatic brain injury (TBI), or TBI combined with a second-hit of electroconvulsive shock (ECS)-induced seizure on day 7. Representative photomicrographs of (A) sham controls on day 8, (B) sham mice administered ECS on day 7 (Sham-ECS) before sacrifice on day 8, (C) mice subject to TBI alone, (D) mice subjected to TBI combined with a second-hit of ECS (TBI-ECS) on day 7, and (E) TBI mice treated acutely with the small molecule Minozac (Mzc) to suppress proinflammatory cytokines (TBI-Mzc-ECS) before ECS on day 7 of recovery. Compared to sham controls, there were significant increases in GFAP following TBI alone (C, TBI), and TBI combined with ECS (D, TBI-ECS). Mice subjected to the two-hits (TBI-ECS) showed greater GFAP-immunoreactive (IR) cell density than ECS alone (Sham-ECS). Administration of Mzc at 3 and 6 h after TBI to suppress proinflammatory cytokines (E, TBI-Mzc-ECS) prevented the increase in GFAP produced by the second hit (Sham-ECS versus TBI-Mzc-ECS, not significant). GFAP-IR cells in digitized images were counted manually. (F) Values are expressed as a percentage of the cell count of the sham controls, and are expressed as mean ± standard error of the mean (**p < 0.01; *** p < 0.001 versus Sham-No ECS by analysis of variance; n = 5–6 per group). Positively stained cells are dark. Sections were counterstained with hematoxylin for contrast (scale bar = 100 μm).
FIG. 3.
FIG. 3.
Quantification of changes in the expression of the astrocyte marker S100B in region CA1 of the hippocampus. All photomicrographs are of day 8 recovery following sham procedure, traumatic brain injury (TBI), or TBI combined with a second-hit of electroconvulsive shock (ECS)-induced seizure on day 7. Representative photomicrographs of (A) sham controls (Sham), (B) sham mice administered ECS on day 7 (Sham-ECS) before sacrifice on day 8, (C) mice subjected to TBI alone (TBI), (D) mice subjected to TBI combined with a second-hit of ECS (TBI-ECS) on day 7, and (E) TBI mice treated acutely with the small molecule Minozac (Mzc) to suppress proinflammatory cytokines (TBI-Mzc-ECS) before ECS on day 7 of recovery. Compared to sham controls, there were significant increases in S100B-immunoreactive (IR) cell density following TBI alone (C, TBI), and TBI combined with ECS (D, TBI-ECS). Mice subjected to the two-hits (TBI-ECS) showed greater density of S100B-IR cells than ECS alone (Sham-ECS). Administration of Mzc at 3and 6 h after TBI to suppress proinflammatory cytokines (E, TBI-Mzc-ECS) prevented the increase in S100B produced by the second hit (Sham-ECS versus TBI-Mzc-ECS, not significant). S100B-IR cells in digitized images were counted manually. (F) Values are expressed as a percentage of the cell count of the sham controls, and are expressed as mean ± standard error of the mean; ***p < 0.05; versus Sham-No ECS by analysis of variance; n = 5–6 per group). Positively stained cells are dark (scale bar = 100 μm).
FIG. 4.
FIG. 4.
Quantification of changes in the expression of the microglial marker Iba1 in region CA1 of the hippocampus. All photomicrographs are of day 8 recovery following sham procedure, traumatic brain injury (TBI), or TBI combined with a second-hit of electroconvulsive shock (ECS)-induced seizure on day 7. Representative photomicrographs of (A) sham controls on day 8, (B) sham mice administered ECS on day 7 (Sham-ECS) before sacrifice on day 8, (C) mice subjected to TBI alone, (D) mice subjected to TBI combined with a second-hit of ECS (TBI-ECS) on day 7, and (E) TBI mice treated with Minozac (Mzc) before ECS on day 7 of recovery (TBI-Mzc-ECS). Compared to sham controls, there were significant increases in the density of Iba1-immunoreactive (IR) cells following TBI alone (C, TBI), TBI combined with ECS (D, TBI-ECS) and two-hit mice treated with Mzc (p < , TBI-Mzc-ECS). Mice subjected to the two-hits (TBI-ECS) showed greater Iba1-IR cell density than ECS alone (Sham-ECS), which was not prevented by administration of Mzc at 3 and 6 h after TBI. Iba1-IR cells in digitized images were counted manually. (F) Values are expressed as a percentage of the cell count of the sham controls, and are expressed as mean ± standard error of the mean; **p < 0.01; *** p < 0.001 versus Sham-No ECS by analysis of variance; n = 5–6 per group). Positively stained cells are dark. Sections were counterstained with hematoxylin for contrast (scale bar = 100 μm).
FIG. 5.
FIG. 5.
Quantification of changes in the expression of metallothionein (MTT) in region CA1 of the hippocampus. All photomicrographs are of day 8 recovery following sham procedure, traumatic brain injury (TBI), or TBI combined with a second-hit of electroconvulsive shock (ECS)-induced seizure on day 7. Representative photomicrographs of (A) sham controls on day 8, (B) mice subjected to TBI combined with a second-hit of ECS (TBI-ECS) on day 7, and (C) TBI mice treated with Minozac (Mzc) before ECS on day 7 of recovery (TBI-Mzc-ECS). Compared to sham controls, there was a significant increase in the density of MTT-immunoreactive cells only in the two-hit group exposed to TBI combined with ECS (B). This increase was prevented by treatment with Mzc (C, TBI-Mzc-ECS). MTT-immunoreactive cells in digitized images were counted manually. (D) Values are expressed as a percentage of the cell count of the sham controls, and are expressed as mean ± standard error or the mean; *p < 0.01 versus Sham-No ECS by analysis of variance; n = 56 per group). Positively stained cells are dark (scale bar = 100 μm).
FIG. 6.
FIG. 6.
Quantification of changes in the expression of glial fibrillary acidic protein (GFAP; AD) and S100B (EH) in region CA1 of the hippocampus. All photomicrographs are of day 14 recovery following sham procedure, traumatic brain injury (TBI), or TBI combined with a second-hit of electroconvulsive shock (ECS)-induced seizure on day 7. Compared to sham controls (A), there was a significant increase in the density of GFAP-immunoreactive (IR) astrocytes following TBI alone (not shown), and in the two-hit group exposed to TBI combined with ECS (B, TBI-ECS). Mice subjected to the two-hits showed increased GFAP-IR cells than ECS alone (Sham-ECS), and this response was prevented by treatment with Mzc (C, TBI-Mzc-ECS). A similar pattern was present for S100B (EG), showing enhanced increase in the two-hit TBI-ECS group (F) compared to sham controls (E), and prevention of this response by Mzc treatment (G). GFAP- and S100B-IR cells in digitized images were counted manually. (D and H) Values in these graphs are expressed as percentages of the cell count of the sham controls, and are expressed as mean ± standard error of the mean; *p < 0.05; ** p < 0.01; *** p < 0.001 versus Sham-No ECS by analysis of variance; n = 5–6 per group). Positively stained cells are dark. Sections were counterstained with hematoxylin for contrast (scale bar = 100 μm).
FIG. 7.
FIG. 7.
Representative photomicrographs of NeuN-immunoreactive cells in region CA1 of the hippocampus. All photomicrographs are of day 14 recovery following sham procedure (A), sham combined with electroconvulsive shock on day 7 (B, Sham-ECS), traumatic brain injury (C, TBI), TBI combined with a second-hit of electroconvulsive shock (ECS)-induced seizure on day 7 (D, TBI-ECS) or two-hit animals treated with Minozac (E, TBI-Mzc-ECS). There were no significant intergroup differences in the density of NeuN-immunoreactive cells (n = 5–6 per group; scale bar = 100 μm).
FIG. 8.
FIG. 8.
Assessment of hippocampal-dependent behavior by latency to escape in the Barnes maze on days 7 (prior to electroconvulsive shock [ECS] on day 8) and 14 recovery after traumatic brain injury (TBI) or sham procedure (open circles, sham controls [Sham-Sal-No ECS]; gray circles, sham subjected to ECS [Sham-Sal-ECS]; triangles, TBI treated with saline [TBI-Sal-No ECS];diamonds, mice subjected to TBI combined with a second-hit of ECS on day 7 [TBI-Sal-ECS]; squares, TBI mice treated with Minozac before ECS on day 7 of recovery [TBI-Mzc-ECS]). Repeated-measures analysis of variance (ANOVA) with Bonferroni's post-test was used to determine differences of each group from baseline values. Differences between groups on day 14 of recovery were measured by ANOVA. On day 14, both the two-hit and TBI-alone groups were significantly impaired compared to their pre-injury performance. Treatment with Mzc after TBI prevented this in the two-hit group. Impairment was increased in the two-hit group on day 14 compared to TBI alone, and again this was prevented by Mzc treatment **p < 0.01; ***p < 0.001 versus Sham-ECS by ANOVA; ##p < 0.01; ###p < 0.001 versus time point 0 by repeated-measures ANOVA; n = 6–7 per group).

References

    1. Altar C. Laeng P. Jurata L. Brockman J. Lemire A. Bullard J. Bukhman Y. Young T. Charles V. Palfreyman M. Electroconvulsive seizures regulate gene expression of distinct neurotrophic signaling pathways. J. Neurosci. 2004;24:2667–2677. - PMC - PubMed
    1. Ambjørn M. Asmussen J. Lindstam M. Gotfryd K. Jacobsen C. Kiselyov V. Moestrup S. Penkowa M. Bock E. Berezin V. Metallothionein and a peptide modeled after metallothionein, EmtinB, induce neuronal differentiation and survival through binding to receptors of the low-density lipoprotein receptor family. J. Neurochem. 2007;104:21–37. - PubMed
    1. Balosso S. Maroso M. Sanchez-Alavez M. Ravizza T. Frasca A. Bartfai T. Vezzani A. A novel non-transcriptional pathway mediates the proconvulsive effects of interleukin-1β. Brain. 2008;131:3256–3265. - PMC - PubMed
    1. Barnes C. Memory deficits associated with senescence: A neurophysiological and behavioral study in the rat. J. Comp. Physiol. Psychol. 1979;93:74–104. - PubMed
    1. Buckmaster P. Zhang G. Yamawaki R. Axon sprouting in a model of temporal lobe epilepsy creates a predominantly excitatory feedback circuit. J. Neurosci. 2002;22:6650–6658. - PMC - PubMed

Publication types

MeSH terms