

Periods of highly synchronous, non-reentrant endocardial activation cycles occur during long-duration ventricular fibrillation
- PMID: 20487123
- PMCID: PMC2935521
- DOI: 10.1111/j.1540-8167.2010.01803.x
Periods of highly synchronous, non-reentrant endocardial activation cycles occur during long-duration ventricular fibrillation
Abstract
Periods of Highly Organized Activation During VF.
Background: Little is known about long-duration ventricular fibrillation (LDVF), lasting 1-10 minutes when resuscitation is still possible.
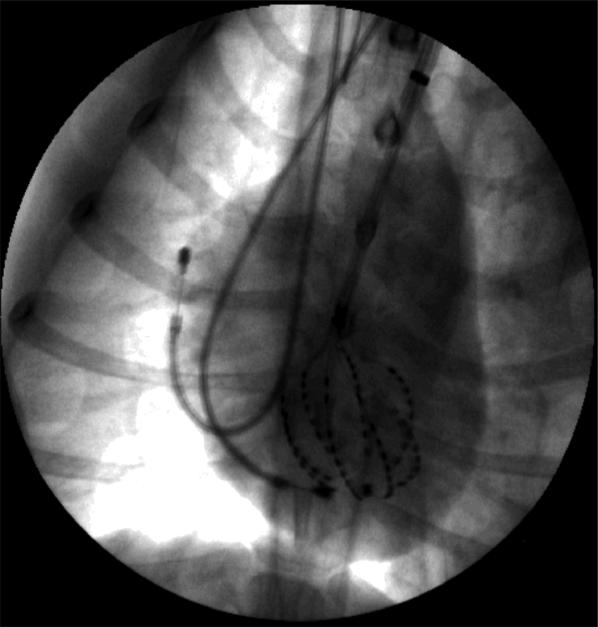
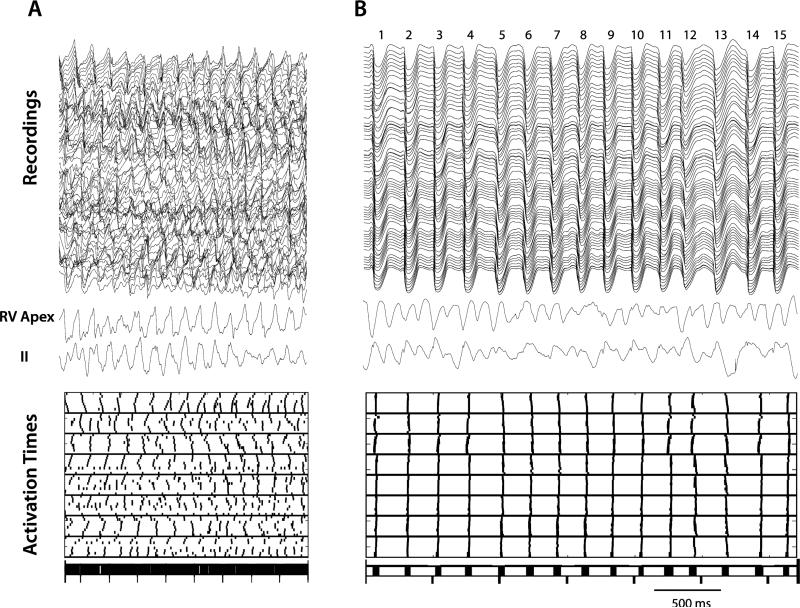
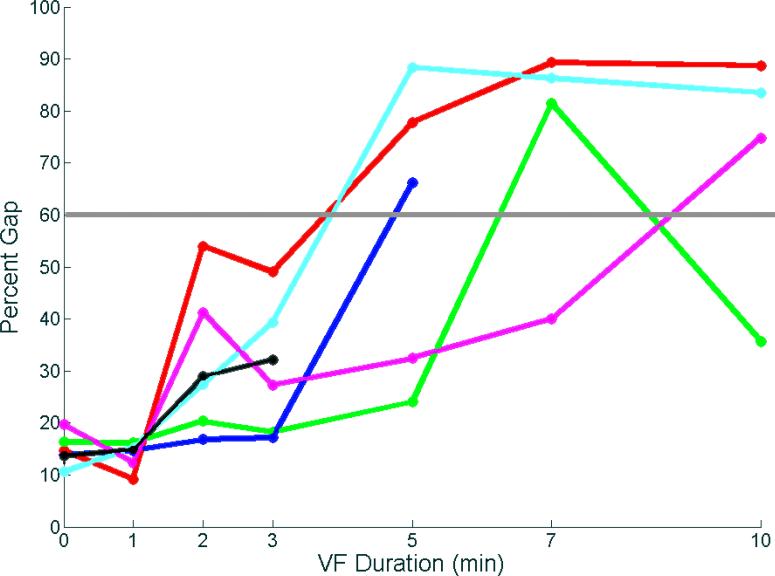
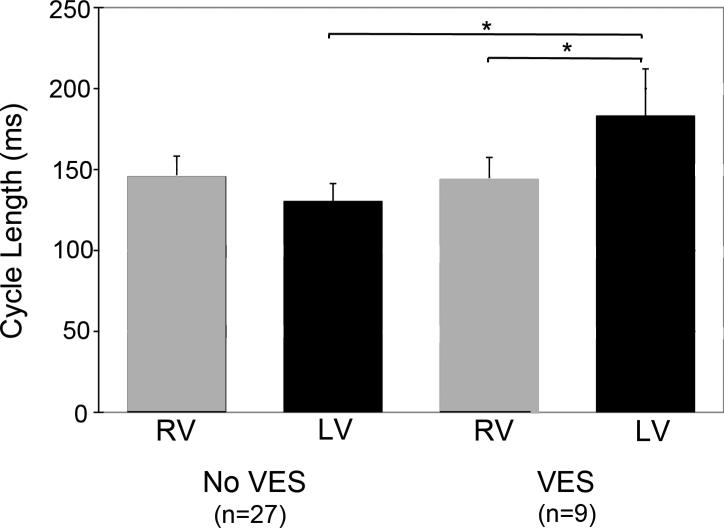
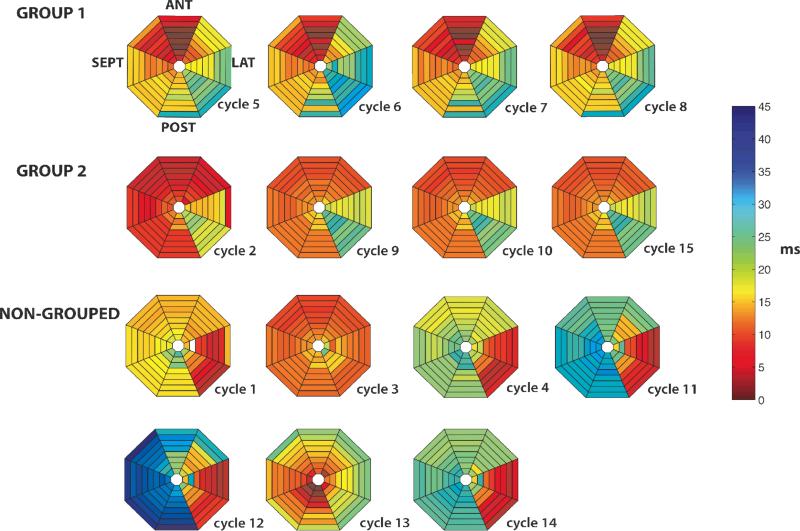
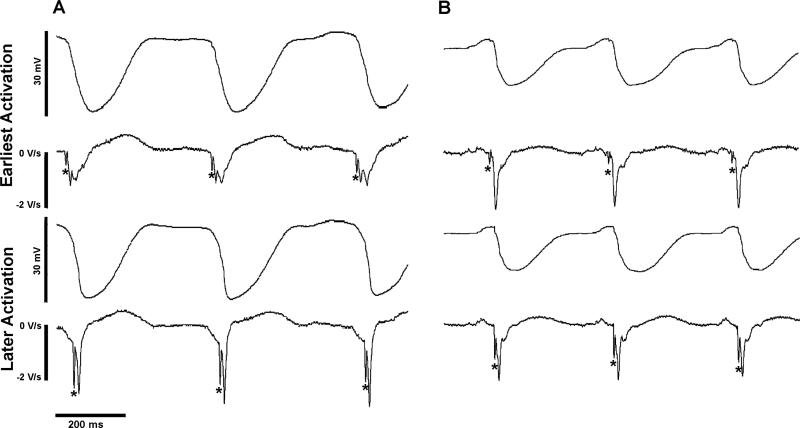
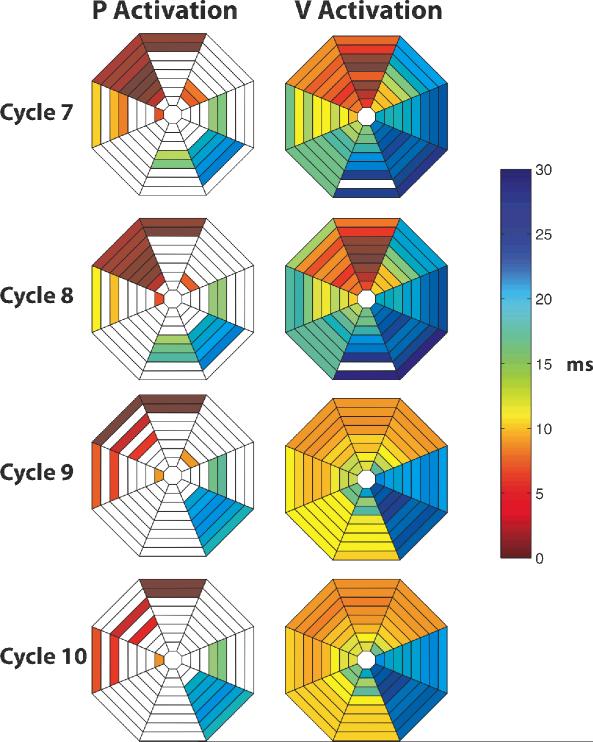
Methods and results: To determine global left ventricle (LV) endocardial activation during LDVF, 6 canines (9.5 ± 0.8 kg) received a 64-electrode basket catheter in the LV, a right ventricular (RV) catheter, and a 12-lead electrocardiogram (ECG). Activation sequences of 15 successive cycles after initiation and after 1, 2, 3, 5, 7, and 10 minutes of LDVF were determined. Early during VF, LV endocardial activation was complex and present throughout most (78.0 ± 9.7%) of each cycle consistent with reentry. After 3-7 minutes of LDVF in 5 animals, endocardial activation became highly synchronized and present for only a small percentage of each cycle (18.2 ± 7.7%), indicating that LV endocardial reentry was no longer present. During this synchronization, activations arose focally in Purkinje fibers and spread as large wavefronts to excite the Purkinje system followed by the subendocardial working myocardium. During this synchronization, the ECG continued to appear irregular, consistent with VF, and LV cycle length (183 ± 29 ms) was significantly different than RV cycle length (144 ± 14 ms) and significantly different than the LV cycle length when synchronization was not present (130 ± 11 ms).
Conclusion: After 3-7 minutes of LDVF, a highly organized, synchronous, focal LV endocardial activation pattern frequently occurs that is not consistent with reentry but is consistent with triggered activity or abnormal automaticity in Purkinje fibers. The ECG continues to appear irregular during this period, partially because of differences in LV and RV cycle lengths.
© 2010 Wiley Periodicals, Inc.
Figures
Comment in
-
Mechanisms of fibrillation: neurogenic or myogenic? Reentrant or focal? Multiple or single? Still puzzling after 160 years of inquiry.J Cardiovasc Electrophysiol. 2010 Nov;21(11):1274-5. doi: 10.1111/j.1540-8167.2010.01820.x. J Cardiovasc Electrophysiol. 2010. PMID: 20550608 Free PMC article. No abstract available.
Similar articles
-
Endocardial focal activation originating from Purkinje fibers plays a role in the maintenance of long duration ventricular fibrillation.Croat Med J. 2014 Apr;55(2):121-7. doi: 10.3325/cmj.2014.55.121. Croat Med J. 2014. PMID: 24778098 Free PMC article.
-
Global Bi-ventricular endocardial distribution of activation rate during long duration ventricular fibrillation in normal and heart failure canines.BMC Cardiovasc Disord. 2017 Apr 13;17(1):99. doi: 10.1186/s12872-017-0530-5. BMC Cardiovasc Disord. 2017. PMID: 28407744 Free PMC article.
-
Endocardial Activation Drives Activation Patterns During Long-Duration Ventricular Fibrillation and Defibrillation.Circ Arrhythm Electrophysiol. 2017 Dec;10(12):e005562. doi: 10.1161/CIRCEP.117.005562. Circ Arrhythm Electrophysiol. 2017. PMID: 29247031 Free PMC article.
-
Complex structure of electrophysiological gradients emerging during long-duration ventricular fibrillation in the canine heart.Am J Physiol Heart Circ Physiol. 2010 Nov;299(5):H1405-18. doi: 10.1152/ajpheart.00419.2010. Epub 2010 Aug 27. Am J Physiol Heart Circ Physiol. 2010. PMID: 20802138 Free PMC article.
-
Our search for the porcine mother rotor.Ann Noninvasive Electrocardiol. 2005 Oct;10(4 Suppl):7-15. doi: 10.1111/j.1542-474X.2005.00071.x. Ann Noninvasive Electrocardiol. 2005. PMID: 16274411 Free PMC article. Review.
Cited by
-
Computational rabbit models to investigate the initiation, perpetuation, and termination of ventricular arrhythmia.Prog Biophys Mol Biol. 2016 Jul;121(2):185-94. doi: 10.1016/j.pbiomolbio.2016.06.004. Epub 2016 Jun 19. Prog Biophys Mol Biol. 2016. PMID: 27334789 Free PMC article. Review.
-
Evolution of activation patterns during long-duration ventricular fibrillation in pigs.Am J Physiol Heart Circ Physiol. 2012 Feb 15;302(4):H992-H1002. doi: 10.1152/ajpheart.00419.2011. Epub 2011 Dec 16. Am J Physiol Heart Circ Physiol. 2012. PMID: 22180655 Free PMC article.
-
His bundle activates faster than ventricular myocardium during prolonged ventricular fibrillation.PLoS One. 2014 Jul 18;9(7):e101666. doi: 10.1371/journal.pone.0101666. eCollection 2014. PLoS One. 2014. PMID: 25036418 Free PMC article.
-
Mechanisms of fibrillation: neurogenic or myogenic? Reentrant or focal? Multiple or single? Still puzzling after 160 years of inquiry.J Cardiovasc Electrophysiol. 2010 Nov;21(11):1274-5. doi: 10.1111/j.1540-8167.2010.01820.x. J Cardiovasc Electrophysiol. 2010. PMID: 20550608 Free PMC article. No abstract available.
-
Cardiac optogenetics.Am J Physiol Heart Circ Physiol. 2013 May;304(9):H1179-91. doi: 10.1152/ajpheart.00432.2012. Epub 2013 Mar 1. Am J Physiol Heart Circ Physiol. 2013. PMID: 23457014 Free PMC article. Review.
References
-
- Valenzuela TD, Roe DJ, Cretin S, Spaite DW, Larsen MP. Estimating effectiveness of cardiac arrest intervention: a logistic regression survival model. Circulation. 1997;96:3308–3313. - PubMed
-
- Valenzuela TD, Roe DJ, Nichol G, Clark LL, Spaite DW, Hardman RG. Outcomes of Rapid Defibrillation by Security Officers after Cardiac Arrest in Casinos. N Engl J Med. 2000;343:1206–1209. - PubMed
-
- Hallstrom AP, Ornato JP, Weisfeldt M, Travers A, Christenson J, McBurnie MA, Zalenski R, Becker LB, Schron EB, Proschan M. Public-access defibrillation and survival after out-of-hospital cardiac arrest. N Engl J Med. 2004;351:637–646. - PubMed
-
- Wik L, Hansen TB, Fylling F, Steen T, Vaagenes P, Auestad BH, Steen PA. Delaying defibrillation to give basic cardiopulmonary resuscitation to patients with out-of-hospital ventricular fibrillation: a randomized trial. JAMA. 2003;289:1389–1395. - PubMed
-
- Weiss JN, Qu Z, Chen PS, Lin SF, Karagueuzian HS, Hayashi H, Garfinkel A, Karma A. The dynamics of cardiac fibrillation. Circulation. 2005;112:1232–1240. - PubMed
Publication types
MeSH terms
Grants and funding
LinkOut - more resources
Full Text Sources
Other Literature Sources
