. 2010 Jul 1;77(1):236-51.
doi: 10.1111/j.1365-2958.2010.07207.x. Epub 2010 May 12.

Interaction specificity, toxicity and regulation of a paralogous set of ParE/RelE-family toxin-antitoxin systems

Affiliations

Interaction specificity, toxicity and regulation of a paralogous set of ParE/RelE-family toxin-antitoxin systems

Aretha Fiebig et al. Mol Microbiol. .

Abstract

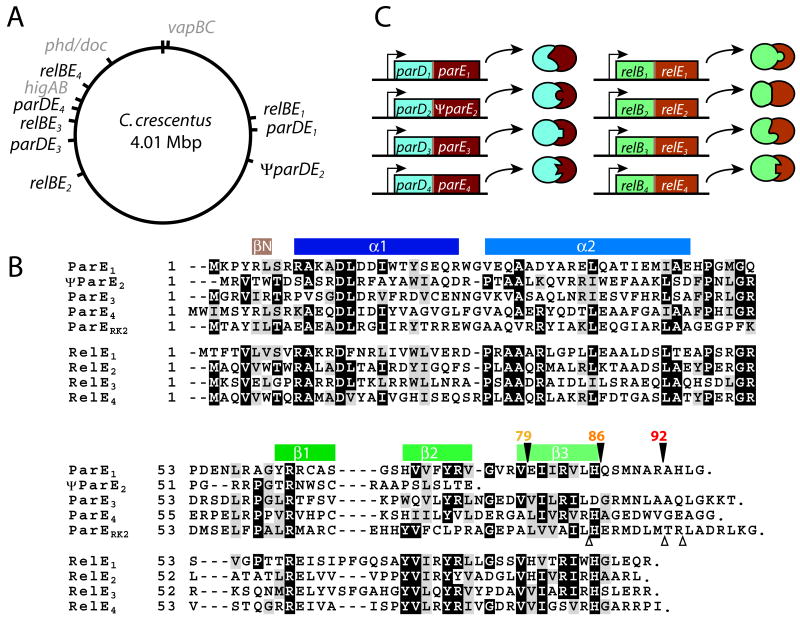
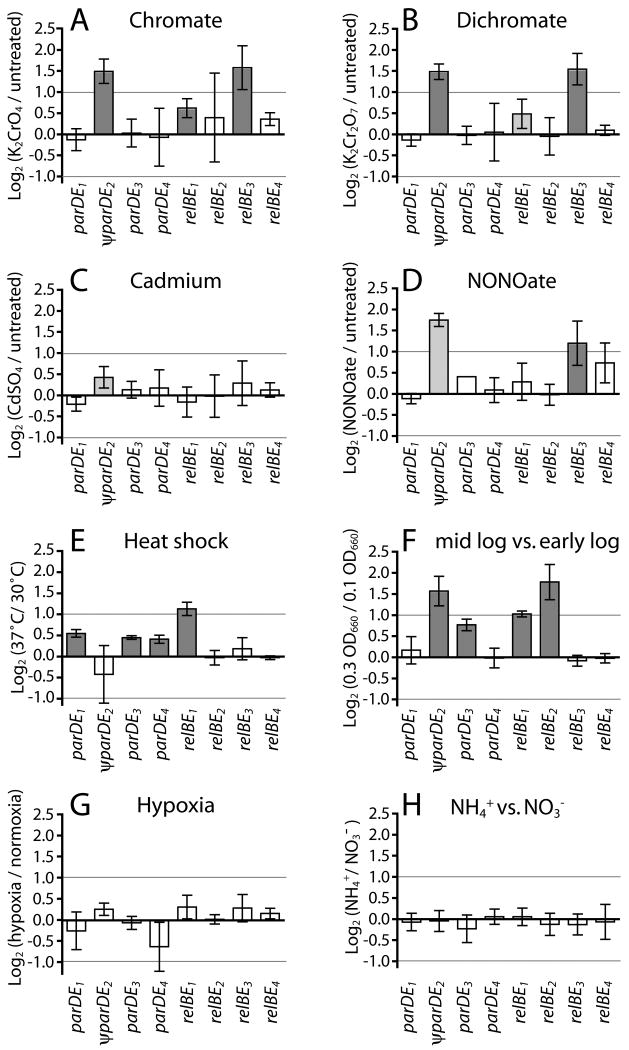
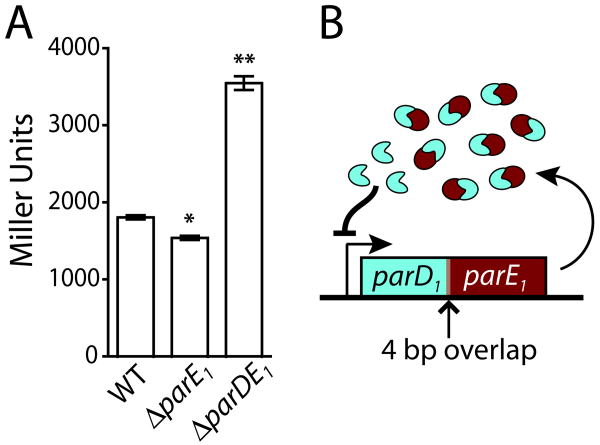
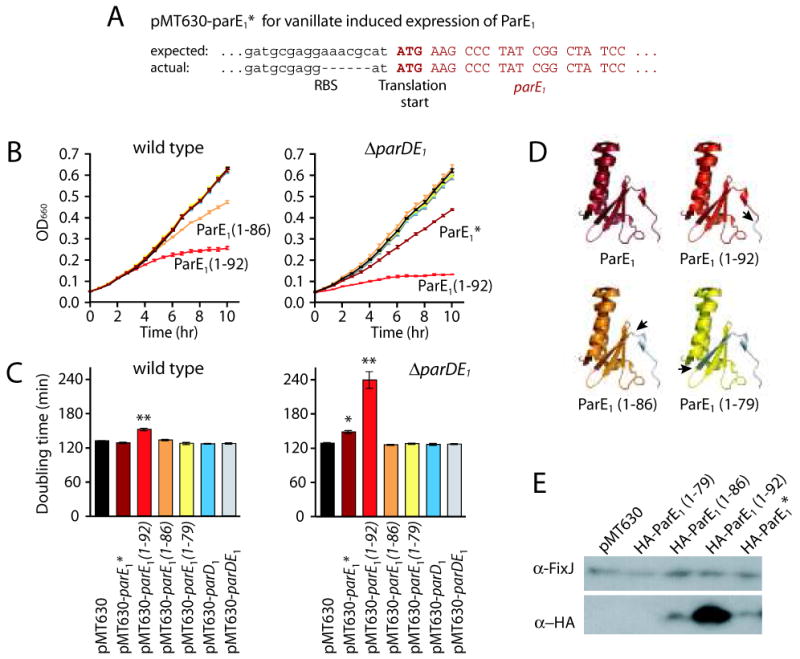
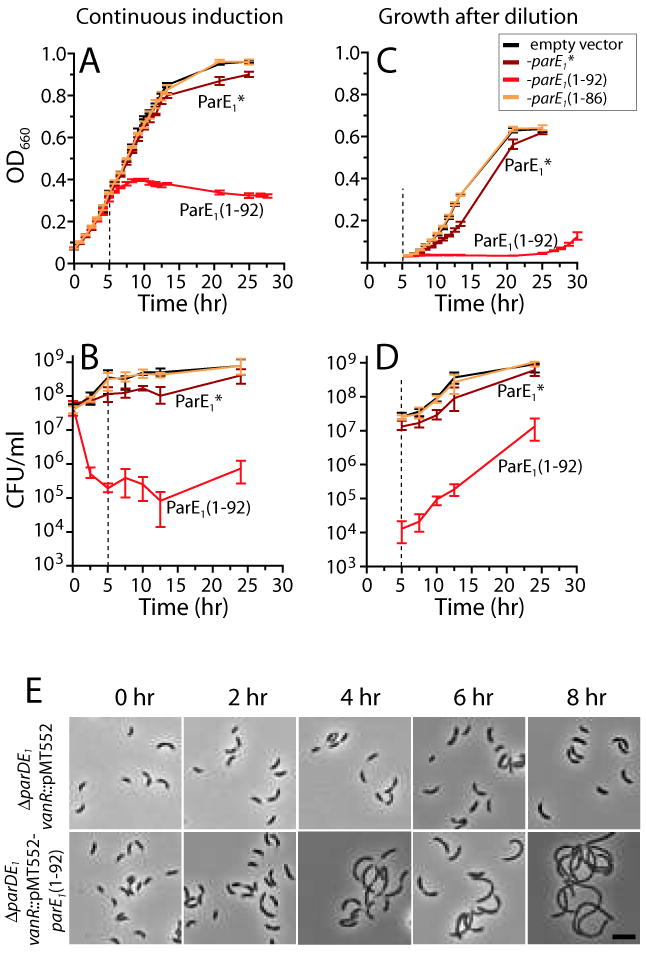
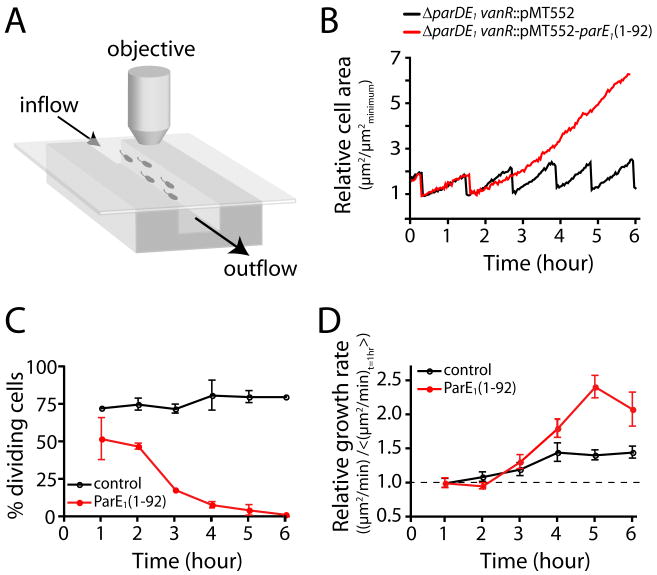
Toxin-antitoxin (TA) gene cassettes are widely distributed across bacteria, archaea and bacteriophage. The chromosome of the alpha-proteobacterium, Caulobacter crescentus, encodes eight ParE/RelE-superfamily toxins that are organized into operons with their cognate antitoxins. A systematic genetic analysis of these parDE and relBE TA operons demonstrates that seven encode functional toxins. The one exception highlights an example of a non-functional toxin pseudogene. Chromosomally encoded ParD and RelB proteins function as antitoxins, inhibiting their adjacently encoded ParE and RelE toxins. However, these antitoxins do not functionally complement each other, even when overexpressed. Transcription of these paralogous TA systems is differentially regulated under distinct environmental conditions. These data support a model in which multiple TA paralogs encoded by a single bacterial chromosome form independent functional units with insulated protein-protein interactions. Further characterization of the parDE(1) system at the single-cell level reveals that ParE(1) toxin functions to inhibit cell division but not cell growth; residues at the C-terminus of ParE(1) are critical for its stability and toxicity. While continuous ParE(1) overexpression results in a substantial loss in cell viability at the population level, a fraction of cells escape toxicity, providing evidence that ParE(1) toxicity is not uniform within clonal cell populations.


Figures

Fig. 1
Fig. 1
The C. crescentus genome encodes eight toxins in the ParE/RelE superfamily. A. The genomic positions of predicted toxin-antitoxin operon in the C. crescentus genome (Pandey and Gerdes, 2005). parE or relE homologs are black; other TA families are grey. oriC is at the top of the circle B. ClustalW alignment of ParE/RelE homologues from C. crescentus and the plasmid RK2 (Larkin et al., 2007). Residues that are similar or identical in 60% of the sequences are shaded in grey or black, respectively. Colored bars indicate secondary structure elements defined in the ParE1 crystal structure (Dalton and Crosson, 2010). Filled triangles above ParE1 indicate the sites of C-terminal truncations engineered in this study. Open triangles below ParERK2 indicate truncations that prevent this toxin from stabilizing plasmids (Roberts and Helinski, 1992). C. Schematic representation of simultaneous expression of multiple ParD-ParE and RelB-RelE pairs, each with unique interaction interfaces resulting in insulated, protein-protein complexes.
Fig. 2
Fig. 2
Expression of parE/relE-family TA systems is differentially regulated under distinct conditions. Expression of each operon was measured in pairs of conditions by Affymetrix GeneChip (A-C (Hu et al., 2005) and G), spotted oligo array (D and H) or promoter fusion to lacZ (E-F). The ratio of expression between conditions was log2 transformed and the mean (+/- standard deviation) is presented. Filled bars indicate means significantly different from 0 (one sample t-test); p<0.005 dark gray, p<0.05 light gray. Microarrays were conducted in duplicate to quadruplicate (see methods) and values for both genes in the operon were averaged; β-galactosidase activities were measured in paired cultures on three independent days (n=6). Light lines indicate two-fold differences in expression (log2 expression ratio = +/-1).
Fig. 3
Fig. 3
ParD1 represses transcription of parDE1. A. The promoter of parDE1 was fused to lacZ in the plasmid pRKLac290. β-galactosidase activity was measured as a proxy for transcriptional activity from this promoter in wild-type, ΔparE1 and ΔparDE1 cells. Cultures were grown in PYE to early log phase (mean +/- SEM, n=6). Significance was assessed using 1-way ANOVA and Tukey post-test; * p< 0.01, **p< 0.001. B. Model representing the auto-repressor activity of ParD1. parDE1 operon is shown indicating the 4 bp overlap between parD1 and parE1.
Fig. 4
Fig. 4
Expression of ParE1 from the multi-copy plasmid pMT630 impairs growth; C-terminal truncations affect toxicity and stability of ParE1. Components of the parDE1 operon were expressed from pMT630, a low-copy, vanillate-inducible expression plasmid, in wild-type or ΔparDE1 cells. A. Cloning of the full-length parE1 gene required truncation of the ribosome binding site in pMT630. Plasmid and parE1 gene sequences are in black and red respectively. Bases missing in the constructed plasmid are indicated by dashes. B. Growth of cultures in PYE supplemented with vanillate was monitored by optical density (mean +/- SEM; n=6). Colors are as in C; genotypes that differ from the empty vector control are labeled. C. Doubling time of each culture was calculated from the first 4 hours of growth and averaged (+/- SEM). Means were compared using 1-way ANOVA and Tukey post-test; * p< 0.05, **p< 0.001. D. Ribbon diagram of ParE1 monomer structure (Dalton and Crosson, 2010). Sites of C-terminal truncations are indicated by arrows and deleted portions of the sequence are shown in grey. E. Western blot of lysate from wild-type cells expressing N-terminally tagged HA-ParE1 variants from pMT630. Anti-FixJ (CC_0758) antibodies were used to confirm equal loading of lysate in each lane.
Fig. 5
Fig. 5
Overexpression of toxin results in a rapid loss of viability and filamentation in ΔparDE1 cells. A & B. Growth and viability of cultures expressing chromosomally-integrated single-copy parE1 alleles were monitored by optical density every 50 minutes and CFU/ml every 2.5 hours. To ensure continuous induction as vanillate is metabolized, cultures were spiked with additional vanillate every 2.5 hours for the first 12.5 hours. C & D. After 5 hours of induction, as the ParE1(1-92) cultures reach a point of arrest, an aliquot of each culture was diluted 10-fold to dilute inducer (vertical dotted line). Recovery of the diluted cells was monitored by optical density and CFU/ml. Data is averaged from 4 independent cultures. Error bars represent SEM in A and C, and represent the range in B and D. E. Phase contrast images of empty vector control cells (top) and parE1(1-92) expressing cells (bottom) captured throughout the course of induction. Scale bar in lower right image is 5 μm.
Fig. 6
Fig. 6
Single cell analysis of ΔparDE1 cells expressing ParE1(1-92) reveals division arrest, but not growth arrest. A. Schematic of the microfluidic growth chamber used to observe cell growth (adapted from (Siegal-Gaskins and Crosson, 2008)). C. crescentus cells adhere to the glass coverslip via the holdfast and are continuously bathed with fresh media (PYE) containing 500 μM vanillate. B. Cell area vs. time of a growing and dividing empty vector control cell (black) and a cell expressing parE1(1-92) from the vanR locus (red). Abrupt decreases in cell area in the sawtooth trace indicate cell division. C. Percent of cells that divide in a 1-hour interval; mean (+/- SEM) from two independent experiments with each genotype is presented. D. Growth rate (+/- SEM) of individual cells normalized to mean growth rate during the first hour of each experiment (mean +/- SEM; n=20 cells per genotype). See methods for description of growth rate calculation.

Similar articles

Cited by

References

    1. Anantharaman V, Aravind L. New connections in the prokaryotic toxin-antitoxin network: relationship with the eukaryotic nonsense-mediated RNA decay system. Genome Biol. 2003;4:R81. - PMC - PubMed
    1. Boutte CC, Srinivasan BS, Flannick JA, Novak AF, Martens AT, Batzoglou S, Viollier PH, Crosson S. Genetic and computational identification of a conserved bacterial metabolic module. PLoS Genet. 2008;4:e1000310. - PMC - PubMed
    1. Christensen SK, Mikkelsen M, Pedersen K, Gerdes K. RelE, a global inhibitor of translation, is activated during nutritional stress. Proc Natl Acad Sci USA. 2001;98:14328–14333. - PMC - PubMed
    1. Christensen SK, Gerdes K. RelE toxins from bacteria and Archaea cleave mRNAs on translating ribosomes, which are rescued by tmRNA. Mol Microbiol. 2003;48:1389–1400. - PubMed
    1. Christensen SK, Pedersen K, Hansen FG, Gerdes K. Toxin-antitoxin loci as stress-response-elements: ChpAK/MazF and ChpBK cleave translated RNAs and are counteracted by tmRNA. J Mol Biol. 2003;332:809–819. - PubMed

Publication types

MeSH terms