

Phase variation controls expression of Salmonella lipopolysaccharide modification genes by a DNA methylation-dependent mechanism
- PMID: 20487280
- PMCID: PMC2909390
- DOI: 10.1111/j.1365-2958.2010.07203.x
Phase variation controls expression of Salmonella lipopolysaccharide modification genes by a DNA methylation-dependent mechanism
Abstract
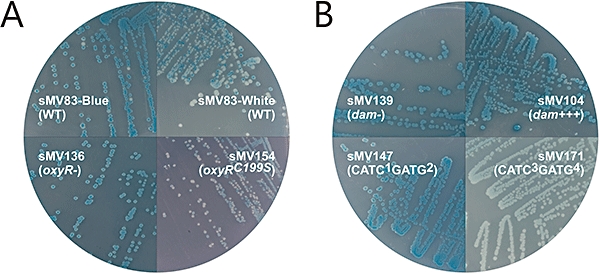
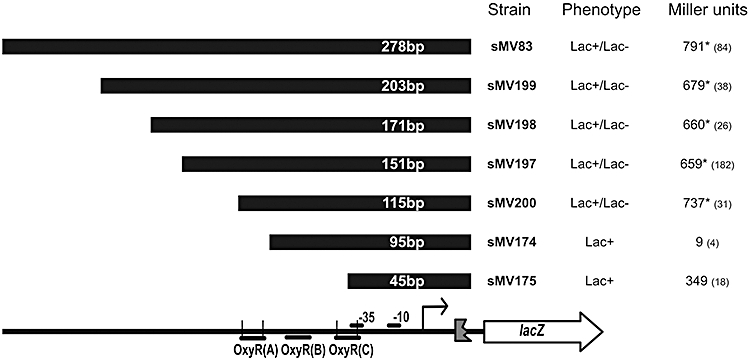
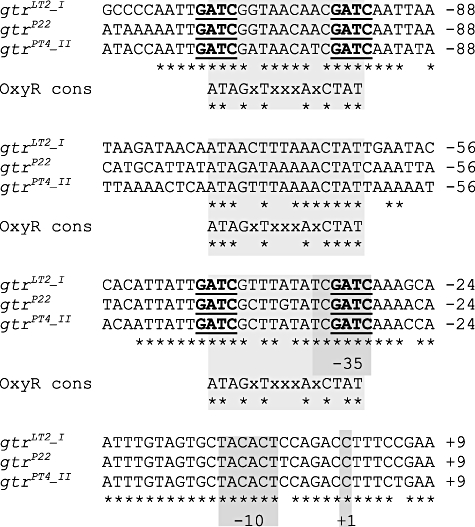
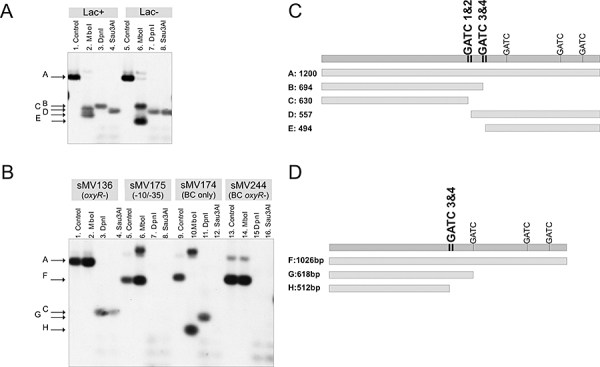
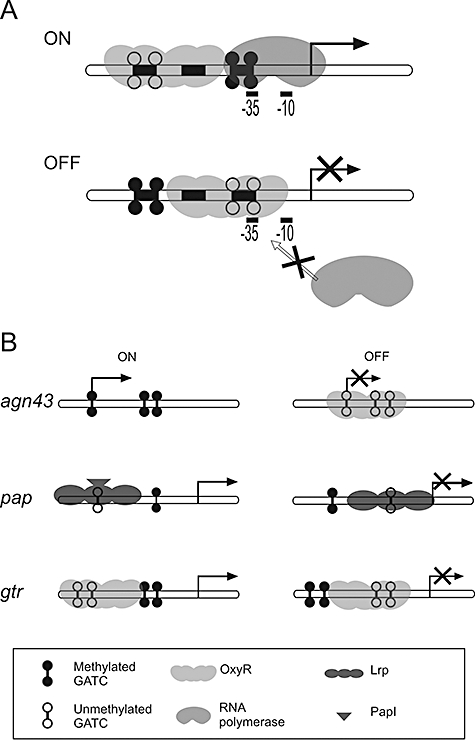
The O-antigen of Salmonella lipopolysaccharide is a major antigenic determinant and its chemical composition forms the basis for Salmonella serotyping. Modifications of the O-antigen that can affect the serotype include those carried out by the products of glycosyltransferase operons (gtr), which are present on specific Salmonella and phage genomes. Here we show that expression of the gtr genes encoded by phage P22 that confers the O1 serotype is under the control of phase variation. This phase variation occurs by a novel epigenetic mechanism requiring OxyR in conjunction with the DNA methyltransferase Dam. OxyR is an activator or a repressor of the system depending on which of its two binding sites in the gtr regulatory region is occupied. Binding is decreased by methylation at Dam target sequences in either site, and this confers heritability of the expression state to the system. Most Salmonella gtr operons share the key regulatory elements that are identified here as essential for this epigenetic phase variation.
Figures
Similar articles
-
Pyrimidine regulation of the Escherichia coli and Salmonella typhimurium carAB operons: CarP and integration host factor (IHF) modulate the methylation status of a GATC site present in the control region.J Mol Biol. 1995 Jul 21;250(4):383-91. doi: 10.1006/jmbi.1995.0384. J Mol Biol. 1995. PMID: 7616563
-
Dam- and OxyR-dependent phase variation of agn43: essential elements and evidence for a new role of DNA methylation.J Bacteriol. 2002 Jun;184(12):3338-47. doi: 10.1128/JB.184.12.3338-3347.2002. J Bacteriol. 2002. PMID: 12029051 Free PMC article.
-
Salmonella enterica Serovar Typhi Lipopolysaccharide O-Antigen Modification Impact on Serum Resistance and Antibody Recognition.Infect Immun. 2017 Mar 23;85(4):e01021-16. doi: 10.1128/IAI.01021-16. Print 2017 Apr. Infect Immun. 2017. PMID: 28167670 Free PMC article.
-
N6-methyl-adenine: an epigenetic signal for DNA-protein interactions.Nat Rev Microbiol. 2006 Mar;4(3):183-92. doi: 10.1038/nrmicro1350. Nat Rev Microbiol. 2006. PMID: 16489347 Free PMC article. Review.
-
DNA methyltransferases and epigenetic regulation in bacteria.FEMS Microbiol Rev. 2016 Sep;40(5):575-91. doi: 10.1093/femsre/fuw023. Epub 2016 Jul 29. FEMS Microbiol Rev. 2016. PMID: 27476077 Review.
Cited by
-
Bacteriophage lambda: Early pioneer and still relevant.Virology. 2015 May;479-480:310-30. doi: 10.1016/j.virol.2015.02.010. Epub 2015 Mar 3. Virology. 2015. PMID: 25742714 Free PMC article. Review.
-
Contribution of DNA adenine methylation to gene expression heterogeneity in Salmonella enterica.Nucleic Acids Res. 2020 Dec 2;48(21):11857-11867. doi: 10.1093/nar/gkaa730. Nucleic Acids Res. 2020. PMID: 32954419 Free PMC article.
-
AamA-mediated epigenetic control of genome-wide gene expression and phenotypic traits in Acinetobacter baumannii ATCC 17978.Microb Genom. 2023 Aug;9(8):mgen001093. doi: 10.1099/mgen.0.001093. Microb Genom. 2023. PMID: 37589545 Free PMC article.
-
An epigenetic switch involving overlapping fur and DNA methylation optimizes expression of a type VI secretion gene cluster.PLoS Genet. 2011 Jul;7(7):e1002205. doi: 10.1371/journal.pgen.1002205. Epub 2011 Jul 28. PLoS Genet. 2011. PMID: 21829382 Free PMC article.
-
Roles of adenine methylation and genetic mutations in adaptation to different temperatures in Serratia marcescens.Epigenetics. 2022 Aug;17(8):861-881. doi: 10.1080/15592294.2021.1966215. Epub 2021 Sep 14. Epigenetics. 2022. PMID: 34519613 Free PMC article.
References
-
- Allison GE, Verma NK. Serotype-converting bacteriophages and O-antigen modification in Shigella flexneri. Trends Microbiol. 2000;8:17–23. - PubMed
-
- Ausubel FM, Brent R, Kingston RE, Moore DD, Seidman JG, Smith JA, et al. Current Protocols in Molecular Biology. New York, NY: Wiley Interscience; 1989.
-
- Bayliss CD. Determinants of phase variation rate and the fitness implications of differing rates for bacterial pathogens and commensals. FEMS Microbiol Rev. 2009;33:504–520. - PubMed
Publication types
MeSH terms
Substances
Grants and funding
LinkOut - more resources
Full Text Sources
Other Literature Sources
