. 2010 Mar;75(5):1090-7.
doi: 10.1111/j.1365-2958.2009.06791.x.

Replication-directed sister chromosome alignment in Escherichia coli

Affiliations
Free PMC article

Replication-directed sister chromosome alignment in Escherichia coli

Xun Liu et al. Mol Microbiol. 2010 Mar.
Free PMC article

Abstract

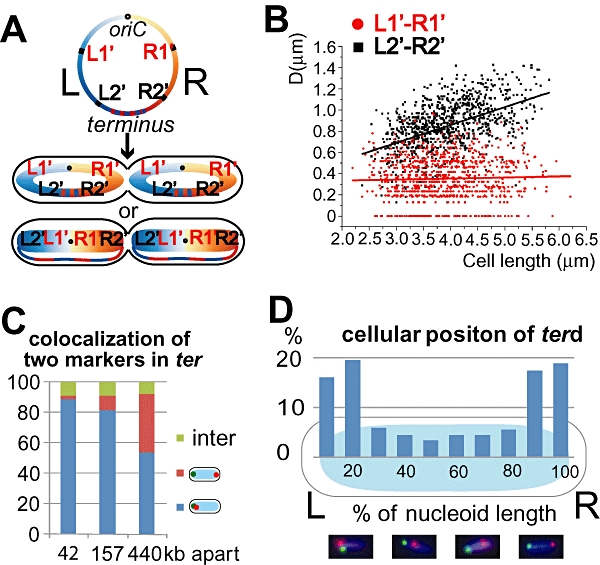
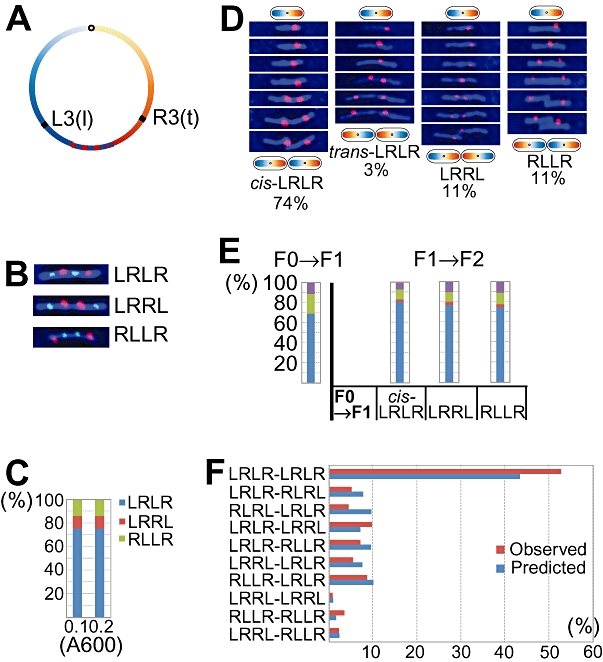
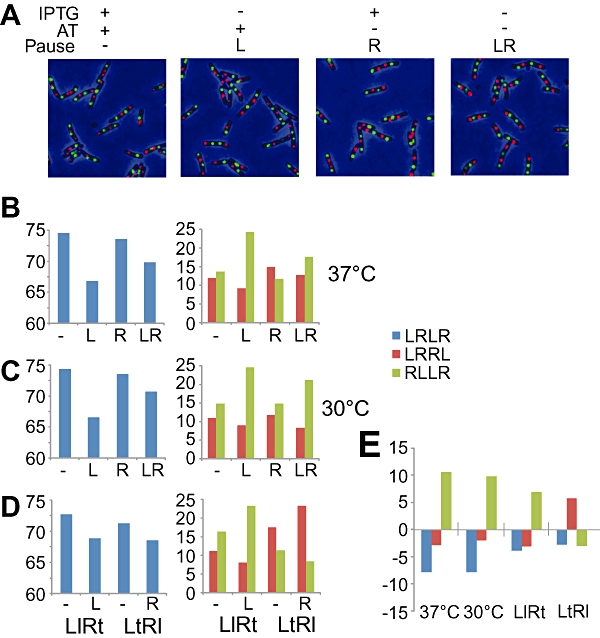
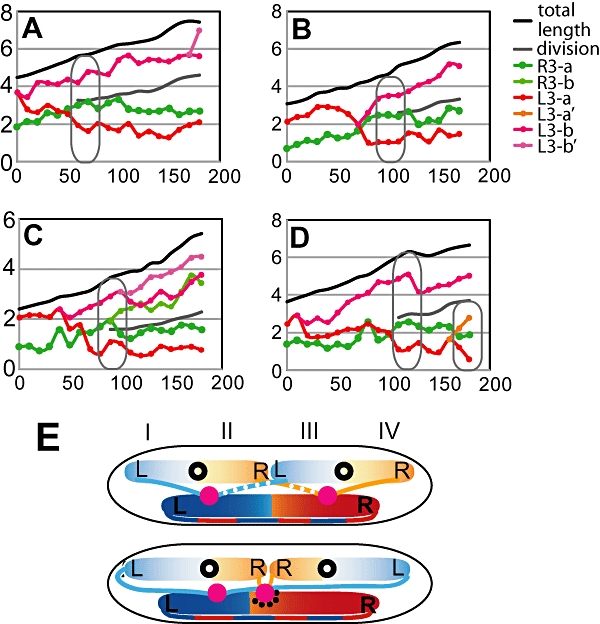
Non-replicating Escherichia coli chromosomes are organized as sausage-shaped structures with the left (L) and the right (R) chromosome arms (replichores) on opposite cell halves and the replication origin (oriC) close to midcell. The replication termination region (ter) therefore passes between the two outer edges of the nucleoid. Four alignment patterns of the two <LR> sister chromosomes within a cell have been detected in an asynchronous population, with the <LRLR> pattern predominating. We test the hypothesis that the minority <LRRL> and <RLLR> patterns arise because of pausing of DNA replication on the right and left replichores respectively. The data resulting from transient pausing or longer-term site-specific blocking of replication show that paused/blocked loci remain close to midcell and the normally replicated-segregated loci locate to the outer regions of the nucleoid, therefore providing experimental support for a direct mechanistic link between DNA replication and chromosome organization.


Figures

Fig. 1
Fig. 1
A. The doughnut and sausage models for E. coli chromosome organization. The genomic position of L1′, R1′, L2′ and R2′parS loci are shown on a simplified E. coli genome map (left panel), and their predicted cellular positions according to the two models are shown in two cartoon cells (right panel). The L and the R replichores are shown in blue and orange, respectively, on the genome map and in the schematic cells. Both schematic cells shown adopt a <LRLR> SCA. B. Average distances of L1′-R1′ and L2′-R2′ focus pairs plotted against cell length. In this plot, each DL1′-R1′ (or DL2′-R2′) represents the average of the two dL1′-R1′ (or dL2′-R2′) in each cell. The red (or black) line shows the linear best fit for all the R1′-R2′ (or L1′-L2′) data points. ∼1000 cells, or ∼2000 focus pairs, were analysed for each strain. C. Colocalization of two ter loci. Three strains with pairs of loci in ter separated by 42 kb (terd and ter3), 157 kb (ter2 and ter3) and 440 kb (ter2 and ter4; see Wang et al., 2005; 2006) were examined. Young cells (cells with one focus for each locus and with no visible nucleoid splitting) were classified into three types: those with the two loci at the same pole (blue), at opposite poles (red) and at an intermediate position. Shown are the averages of two independent experiments for each strain, with more than 400 cells analysed for each experiment. D. Cellular positioning of a terd locus (8 kb clockwise from dif) in young cells. The precise longitude position of the terd locus within the nucleoid was measured in a strain colabelled with L3 for directionality. The population was binned into 10 groups according to the position relative to the nucleoid (illustrated as an oval) and the percentages are shown in histograms. A total of 288 cells were measured. Examples of individual micrographs are shown underneath, terd marker in red, L3 in green.
Fig. 2
Fig. 2
A. The genomic positions of L3 lacO and R3 tetO array loci. B. Snapshot images of cells adopting <LRLR>, <LRRL> or <RLLR> SCA. The L3 (or R3) foci are shown in green (or red). C. Proportions of cells with <LRLR> (blue), <LRRL> (red) or <RLLR> (green) SCA. Three experiments at different A600 are presented and ∼1000 cells were analysed for each experiment. D. Four time-lapse series (20 min interval) of F0→F1 cell generations adopting cis-<LRLR>, trans-<LRLR>, <LRRL> or <RLLR> SCA. The R3 foci are shown in red. The proportions of F0→F1 events adopting each SCA are shown at the bottom of each column. ∼3000 cell generations from 20 experiments were pooled and presented. E. Proportions of F0→F1 or F1→F2 events adopting cis-<LRLR> (blue), trans-<LRLR> (red), <LRRL> (green) or <RLLR> (purple) SCA. The first column shows the SCA proportions of the F0→F1 events (615 generations). The next three columns show the SCA proportions of the cis-<LRLR> (844 events), <LRRL> (240 events) or <RLLR> (142 events) F1→F2 groups. The trans-<LRLR> F1→F2 group was not included because it was too small (four events). F. Predicted and observed proportions of eight-focus (four sister chromosomes) cephalexin filaments. Predicted proportions are shown in blue (Supporting information) and observed proportions are shown in red.
Fig. 3
Fig. 3
A. Snapshot images of cells growing in 37°C medium with the indicated combinations of inducers at saturating concentrations (IPTG: 0.5 mM, AT: 40 ng ml−1). ‘Pause’ refers to the replichore(s) affected by repressor-operator tight binding. The L3 foci are shown in green and the R3 foci in red. ∼2000 cells were analysed for each growth condition and the results are shown in Fig. 3B and C. B. The SCA proportions (cis-<LRLR> in blue, <LRRL> in red and <RLLR> in green) of cells with designated combinations of replichores affected by repressor-operator tight binding at 37°C. C. The SCA proportions of cells with designated combinations of replichores affected by repressor-operator tight binding at 30°C. D. The SCA proportions of L3lacO-R3tetO (‘LlRt’) or L3tetO-R3lacO (‘LtRl’) cells with designated combinations of replichores affected by repressor-operator tight binding at 37°C. E. Level and direction of changes in SCA proportions under the LacI-lacO tight binding condition when compared with corresponding ‘no tight binding’ reference values. The ‘37°C’ and ‘30°C’ columns are from Fig. 3B and C, showing the SCA proportion changes from ‘−’ to ‘L’ at 37°C and 30°C respectively. The ‘LlRt’ and ‘LtRl’ columns are from Fig. 3D, showing the SCA proportion changes from ‘−’ to ‘L′ and from ‘−’ to ‘R’, respectively, at 37°C.
Fig. 4
Fig. 4
A–D. Time-lapse progressions showing L3-R3 loci after a replication block at R3. Replication block was applied to R3 (showed in green) by removing AT in M9 glycerol liquid culture for 60 min, while L3 (red and pink) could replicate as normal. The cells were then transferred to a slide mounted with the same medium plus 1% agarose. Pictures were taken every 10 min in a 3 h experiment. The schematics of cells (black cell-shaped outlines) are inserted to indicate the organization of loci in a cell of the indicated size. E. Schematic model for how replication directs chromosome organization. Replisomes are shown in pink. Leading and lagging strands are shown in smooth and dotted threads respectively. The replisome affected by pausing is marked with black dots. The whole cell is divided into four quarters marked by roman numbers. The upper cell adopts the cis-<LRLR> SCA, and the lower cell adopts the <LRRL> SCA.

Similar articles

Cited by

References

    1. Cui T, Moro-oka N, Ohsumi K, Kodama K, Ohshima T, Ogasawara N, et al. Escherichia coli with a linear genome. EMBO Rep. 2007;8:181–187. - PMC - PubMed
    1. Espéli O, Mercier R, Boccard F. DNA dynamics vary according to macrodomain topography in the E. coli chromosome. Mol Microbiol. 2008;68:1418–1427. - PubMed
    1. Lau IF, Filipe SR, Søballe B, Økstad OA, Barre FX, Sherratt DJ. Spatial and temporal organization of replicating Escherichia coli chromosomes. Mol Microbiol. 2003;49:731–743. - PubMed
    1. Mercier R, Petit M-A, Schbath S, Robin S, El-Karoui M, Boccard F, Espéli O. The MatP/matS site-specific system organizes the terminus region of the E. coli chromosome into a macrodomain. Cell. 2008;135:475–485. - PubMed
    1. Michel B, Recchia GD, Penel-Colin M, Ehrlich SD, Sherratt DJ. Resolution of Holliday junctions by RuvABC prevents dimer formation in rep mutants and UV-irradiated cells. Mol Microbiol. 2000;37:180–191. - PubMed

Publication types