. 2010 Jul 23;400(4):702-14.
doi: 10.1016/j.jmb.2010.05.022. Epub 2010 May 19.

Calmodulin disrupts the structure of the HIV-1 MA protein

Affiliations

Calmodulin disrupts the structure of the HIV-1 MA protein

John Y H Chow et al. J Mol Biol. .

Erratum in

  • J Mol Biol. 2011 Oct 28;413(3):742

Abstract

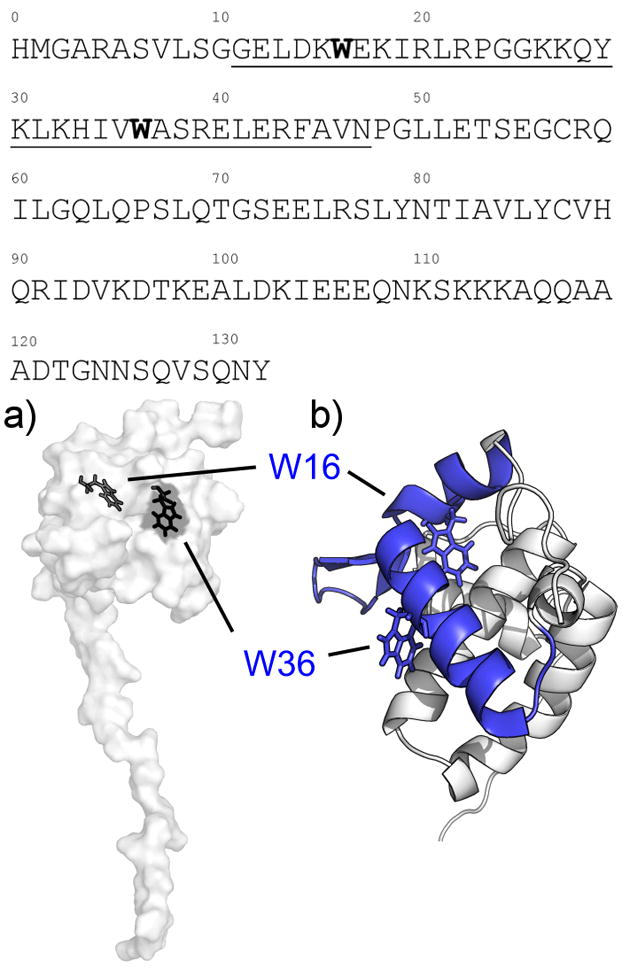
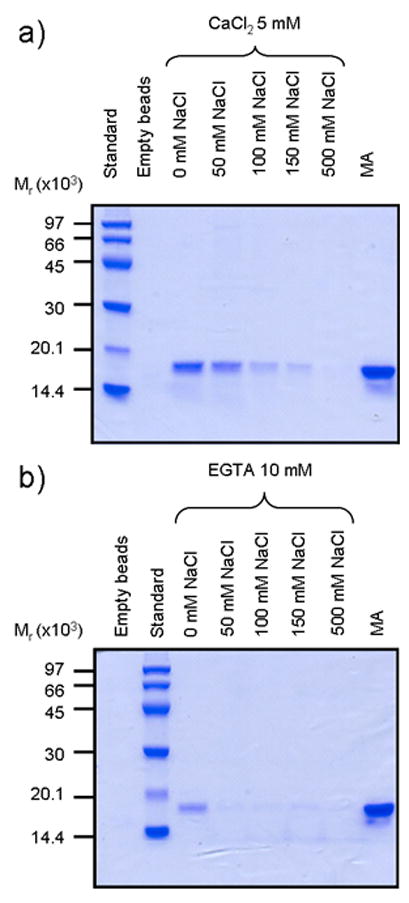
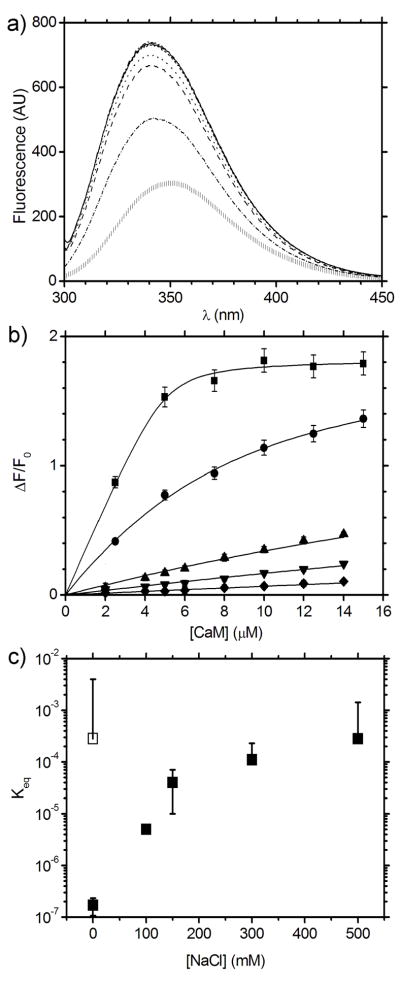
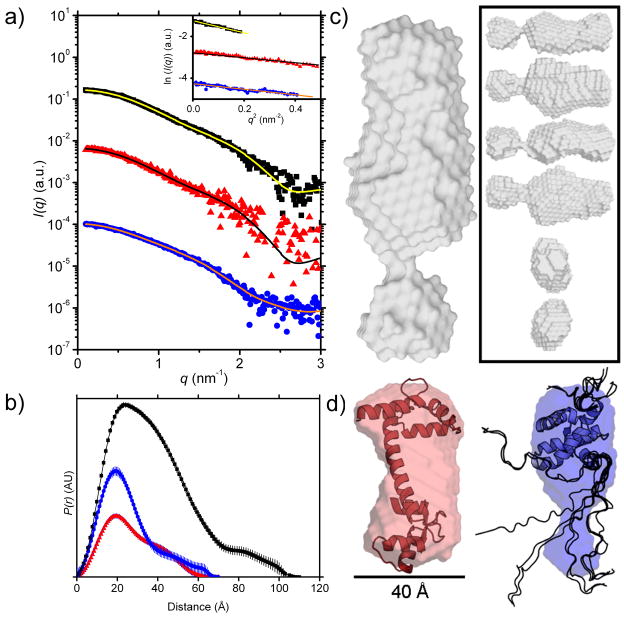
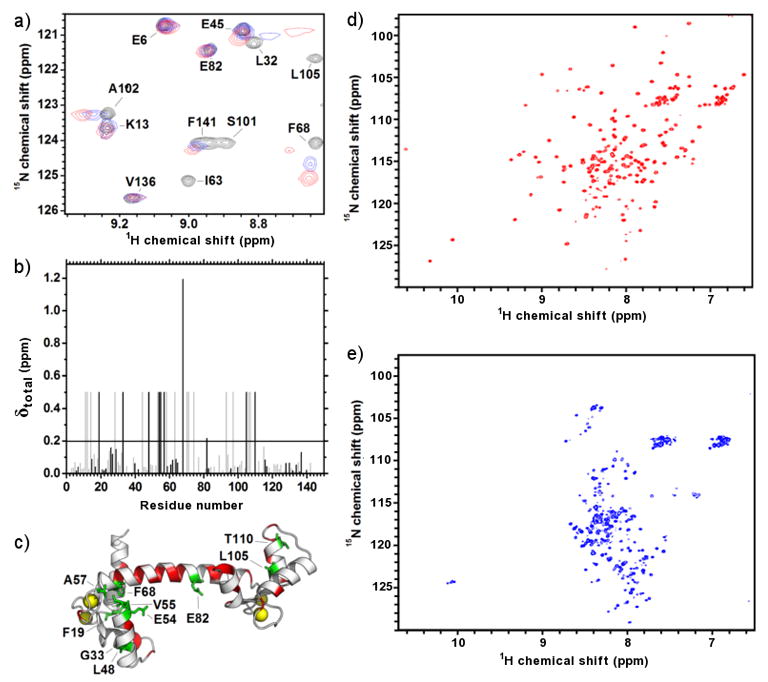
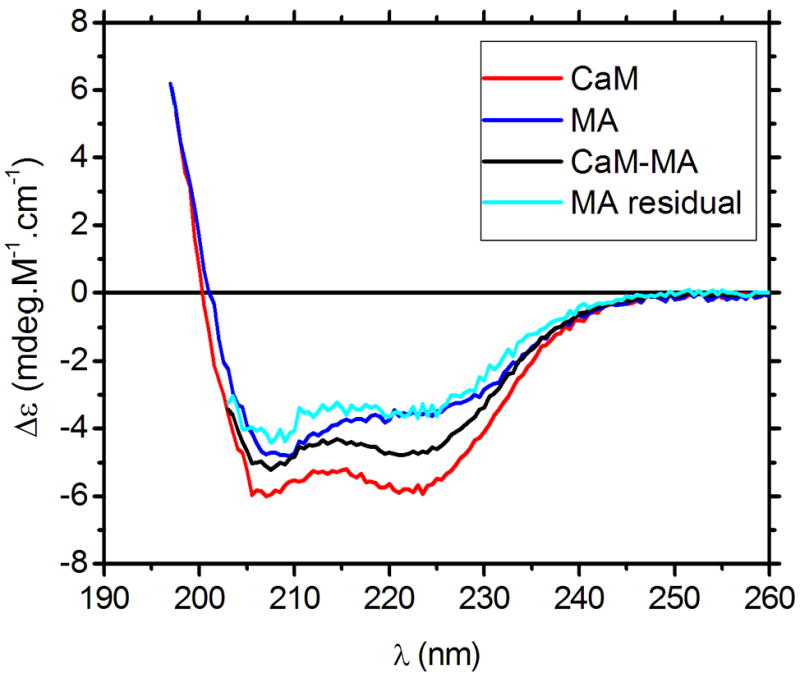
The MA protein from HIV-1 is a small, multifunctional protein responsible for regulating various stages of the viral replication cycle. To achieve its diverse tasks, MA interacts with host cell proteins and it has been reported that one of these is the ubiquitous calcium-sensing calmodulin (CaM), which is up-regulated upon HIV-1 infection. The nature of the CaM-MA interaction has been the subject of structural studies, using peptides based on the MA sequence, that have led to conflicting conclusions. The results presented here show that CaM binds intact MA with 1:1 stoichiometry in a Ca(2+)-dependent manner and that the complex adopts a highly extended conformation in solution as revealed by small-angle X-ray scattering. Alterations in tryptophan fluorescence suggest that the two buried tryptophans (W16 and W36) located in the first two alpha-helices of MA mediate the CaM interaction. Major chemical shift changes occur in the NMR spectrum of MA upon complex formation, whereas chemical shift changes in the CaM spectrum are quite modest and are assigned to residues within the normal target protein-binding hydrophobic clefts of CaM. The NMR data indicate that CaM binds MA via its N- and C-terminal lobes and induces a dramatic conformational change involving a significant loss of secondary and tertiary structure within MA. Circular dichroism experiments suggest that MA loses approximately 20% of its alpha-helical content upon CaM binding. Thus, CaM binding is expected to impact upon the accessibility of interaction sites within MA that are involved in its various functions.


Figures

Figure 1
Figure 1. CaM-binding sites on the MA structure
(Top) Amino acid sequence for the MA construct used in this experiment, depicting the proposed CaM-binding sites (underlined) and the tryptophan residues located within (bold). a) Surface depiction of the MA NMR structure (PDB: 2HMX) showing the tryptophan residues (black) located within the N-terminal lobe of MA, with W16 completely buried within the hydrophobic core while W36 is partially exposed to solvent. b) Closeup view of the N-terminal globular domain of MA and the CaM-binding site (blue) in cartoon form. The site is composed of two short α-helices connected by a basic loop region.
Figure 2
Figure 2. Effect of Ca2+ and NaCl on the interaction between CaM and MA monitored by SDS-PAGE pulldown assays
Molecular mass marker sizes (Mr) are shown along the left edge. a) Interactions between CaM and MA in high calcium buffer. Lane 1: molecular mass standards; lane 2: CaM-agarose beads only; lanes 3–7: CaM-agarose + MA in 0, 50, 100, 150, or 500 mM NaCl; lane 8: MA alone. b) Interactions between CaM and MA in low calcium buffer. Lane 1: CaM-agarose beads only; lane 2: molecular mass standards; lanes 3–7: CaM-agarose + MA in 0, 50, 100, 150, or 500 mM NaCl; lane 8: MA only.
Figure 3
Figure 3. Dependence of the affinity between Ca2+-CaM and MA as a function of NaCl concentration
a) Tryptophan fluorescence emission spectra for the titration of Ca2+-CaM and MA in 0 mM NaCl demonstrating the shift in peak emission wavelength from MA alone ( | ) to saturated Ca2+-CaM-MA (solid line). b) Change in fluorescence intensity (ΔF/F0) from MA at 334 nm upon binding Ca2+-CaM as a function of [NaCl]: 0 mM NaCl (■); 100 mM (●); 150 mM (▲); 300 mM (▼); and 500 mM (◆). Each data point is the average of measurements and the error bars correspond to ± 1 standard deviation. c) CaM-MA Keq vs. NaCl concentration in the presence of Ca2+ (■), and in the absence of Ca2+ (with EGTA chelator, □).
Figure 4
Figure 4. SAXS analysis of Ca2+-CaM, MA, and Ca2+-CaM-MA
a) I(q) vs. q plots of SAXS data for the complex (black ■, 9.7 mg.mL−1), Ca2+-CaM (red ▲, 5.0 mg.mL−1), and MA (blue ●, 8.0 mg.mL−1). The plots for Ca2+-CaM and MA have been arbitrarily shifted on the vertical axis for clarity. Superimposed lines indicate the P(r) fit to the data. (Inset) Guinier plots (data points) and linear fits (lines) to the SAXS data for the complex (black ■), Ca2+-CaM (red ▲), and MA (blue ●) to qRg < 1.3. The plots for Ca2+-CaM and MA have been arbitrarily shifted on the vertical axis for clarity. All curves are linear as expected for monodisperse samples. Propagated errors based on counting statistics were smaller than symbol size in low q region (< 0.15 Å−1) and indicated by the scatter around the fitted lines at higher q. b) SAXS P(r) profiles for the complex (black ■, Dmax = 110 Å), Ca2+-CaM (red ▲, Dmax = 70 Å), MA (blue ●, Dmax = 60 Å). c) Ca2+-CaM-MA envelope (grey), (inset) different orientations of Ca2+-CaM-MA (grey), d) free Ca2+-CaM with superimposed structure (left, red, PDB entry: 1CLL) plus scale bar and free MA with superimposed structure (right, blue, PDB entry: 2HMX, NMR ensemble models 1–10 out of 20). Structures are drawn to relative scale. MA contains two unstructured regions in the NMR ensemble model (rendered as backbone ribbons): an N-terminal domain around residues 1–10 and the C-terminal ‘tail’ around residues 106–132 which is unstructured according to the NMR data; the shape restoration suggests that the unstructured C-terminal tail is more compact than indicated by the NMR coordinate files.
Figure 5
Figure 5. 15N-1H-HSQC spectra for 15N-CaM bound to MA and 15N-MA bound to Ca2+-CaM
a) Focused region of the HSQC spectra showing the titration of 15N-CaM (black) with unlabelled MA (0.4:1 molar ratio, blue; 1:1 molar ratio, red). b) Amide chemical shift perturbations for 15N-CaM bound to MA indicating unambiguously assigned residues (black) and those which are tentatively assigned (grey). The significant threshold for perturbation (average perturbation + 1 standard deviation) is indicated by a horizontal line. Amide resonances that disappear during complex formation are set to an arbitrary value of 0.5. c) Annotated structure (pdb: 1CLL) of Ca2+-CaM showing unambiguously assigned and perturbed residues (green) and unassigned residues (red). Bound calcium atoms are shown as yellow spheres. The proposed interaction surface of CaM-MA from previous SAXS studies (inset i, orange) and the interaction surface between in Ca2+-CaM-MLCK (inset ii, black) is on the same Ca2+-CaM structure for comparison. d) HSQC spectra for 15N-MA in the absence of CaM showing well dispersed peaks. e) HSQC spectra for 15N-MA in complex with unlabelled CaM demonstrating perturbations in most of the amide resonances.
Figure 6
Figure 6. Far-UV CD spectra tracking changes in secondary structure for CaM-MA
Spectra were recorded for Ca2+-CaM (red line; 8 μM), MA (blue line; 8 μM), and Ca2+-CaM-MA (black line, 8 μM) at 25 °C. The MA residual spectrum (cyan line) was calculated from subtraction of the Ca2+-CaM spectrum from the Ca2+-CaM-MA spectrum, and displays significant differences from the MA spectrum.

Similar articles

Cited by

References

    1. Radding W, Pan ZQ, Hunter E, Johnston P, Williams JP, McDonald JM. Expression of HIV-1 envelope glycoprotein alters cellular calmodulin. Biochem Biophys Res Commun. 1996;218:192–7. - PubMed
    1. Radding W, Williams JP, McKenna MA, Tummala R, Hunter E, Tytler EM, McDonald JM. Calmodulin and HIV type 1: interactions with Gag and Gag products. AIDS Res Hum Retroviruses. 2000;16:1519–25. - PubMed
    1. Mervis RJ, Ahmad N, Lillehoj EP, Raum MG, Salazar FH, Chan HW, Venkatesan S. The gag gene products of human immunodeficiency virus type 1: alignment within the gag open reading frame, identification of posttranslational modifications, and evidence for alternative gag precursors. J Virol. 1988;62:3993–4002. - PMC - PubMed
    1. Kaplan AH, Swanstrom R. Human immunodeficiency virus type 1 Gag proteins are processed in two cellular compartments. Proc Natl Acad Sci U S A. 1991;88:4528–32. - PMC - PubMed
    1. Wiegers K, Rutter G, Kottler H, Tessmer U, Hohenberg H, Krausslich HG. Sequential steps in human immunodeficiency virus particle maturation revealed by alterations of individual Gag polyprotein cleavage sites. J Virol. 1998;72:2846–54. - PMC - PubMed

Publication types

MeSH terms

Substances

LinkOut - more resources