

Modulatory influence of stimulus parameters on optokinetic head-tracking response
- PMID: 20488227
- PMCID: PMC3995157
- DOI: 10.1016/j.neulet.2010.05.031
Modulatory influence of stimulus parameters on optokinetic head-tracking response
Abstract
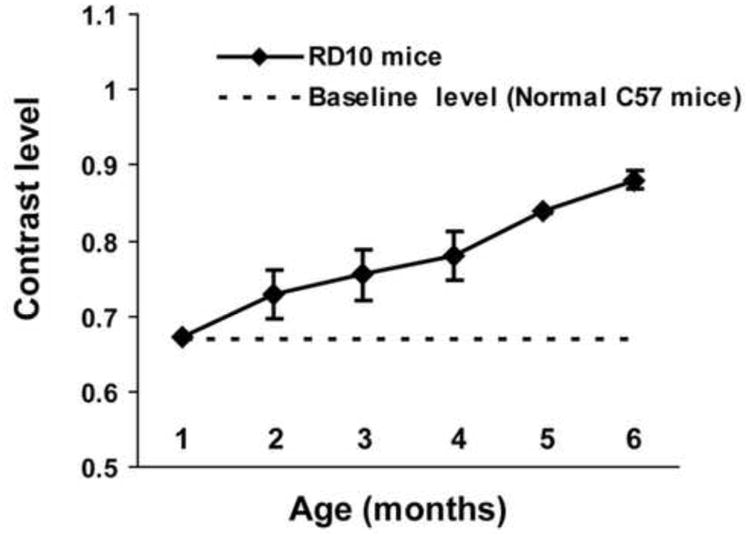
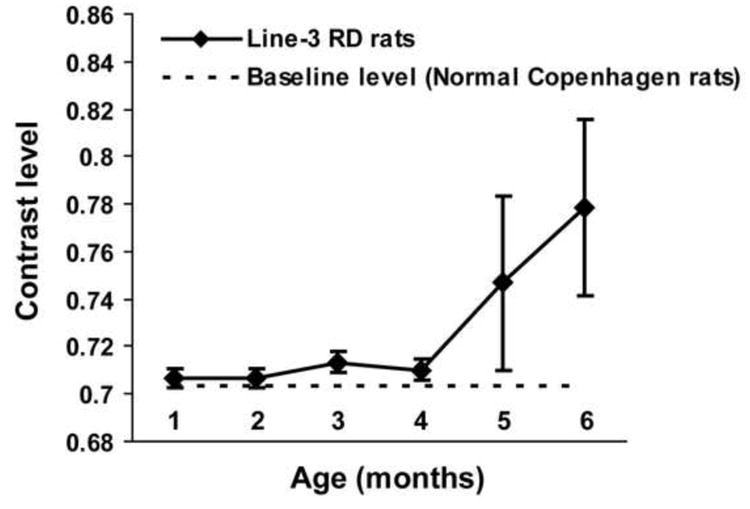
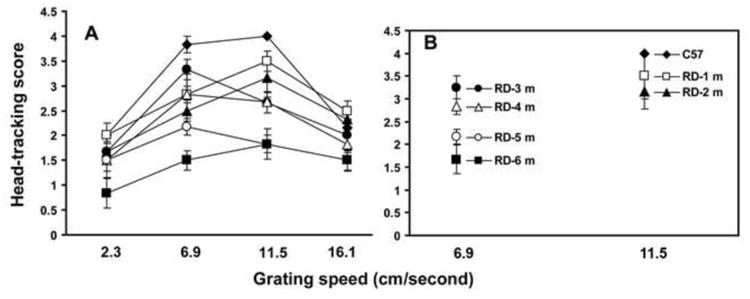
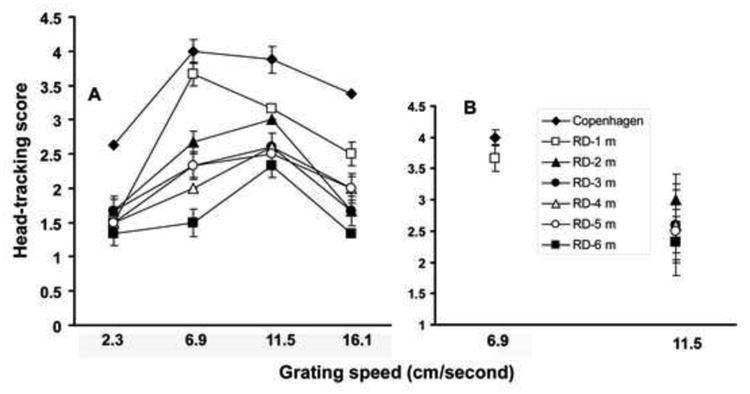
Optokinetic testing is a non-invasive technique, widely used for visual functional evaluation in rodents. The modulatory influence of optokinetic stimulus parameters such as contrast level and grating speed on head-tracking response in normal and retinal degenerate (RD) mice (rd10) and rats (S334ter-line-3) was evaluated using a computer-based testing apparatus. In normal (non-RD) mice and rats, specific stripe width and grating speed was found to evoke maximum optokinetic head-tracking response. In line-3 RD rats, the contrast sensitivity loss was slow and remained close to the baseline (normal control) level until very late in the disease, whereas, in rd10 mice the progression of the contrast sensitivity loss was more rapid. Observed differences between rd10 mice and line-3 RD rats in the progression of contrast sensitivity loss may not be directly related to the degree of photoreceptor loss. In young RD mice, the modulatory influence of stimulus parameters on optokinetic head-tracking response was similar to normal control animals. During later stages, slower grating speed was required to evoke the maximum optokinetic response. Grating speed had lesser apparent influence on the response properties of line-3 RD rats. Discrepancies between the two RD models in the modulatory influence of optokinetic stimulus parameters can be the manifestation of fundamental species differences and/or differences in the degeneration pattern. This study highlights the importance of careful selection of appropriate stimulus parameters for testing optokinetic head-tracking response in RD animals.
Copyright 2010 Elsevier Ireland Ltd. All rights reserved.
Figures
Similar articles
-
Optomotor and immunohistochemical changes in the juvenile S334ter rat.Exp Eye Res. 2012 Nov;104:65-73. doi: 10.1016/j.exer.2012.09.006. Epub 2012 Oct 1. Exp Eye Res. 2012. PMID: 23036564 Free PMC article.
-
Visual functional effects of constant blue light in a retinal degenerate rat model.Photochem Photobiol. 2007 May-Jun;83(3):759-65. doi: 10.1562/2006-09-19-RA-1044. Photochem Photobiol. 2007. PMID: 17115798
-
Optokinetic test to evaluate visual acuity of each eye independently.J Neurosci Methods. 2004 Sep 30;138(1-2):7-13. doi: 10.1016/j.jneumeth.2004.03.007. J Neurosci Methods. 2004. PMID: 15325106
-
Initiation of the optokinetic response (OKR) in mice.J Vis. 2010 Jan 29;10(1):13.1-17. doi: 10.1167/10.1.13. J Vis. 2010. PMID: 20143906
-
Open-loop and closed-loop optokinetic nystagmus in squirrel monkeys (Saimiri sciureus) and in man.Prog Brain Res. 1989;80:183-96; discussion 171-2. doi: 10.1016/s0079-6123(08)62212-8. Prog Brain Res. 1989. PMID: 2699364 Review.
Cited by
-
A New Optokinetic Testing Method to Measure Rat Vision.J Vis Exp. 2022 Jul 27;(185):10.3791/63357. doi: 10.3791/63357. J Vis Exp. 2022. PMID: 35969051 Free PMC article.
-
dCasMINI-mediated therapy rescues photoreceptors degeneration in a mouse model of retinitis pigmentosa.Sci Adv. 2024 Dec 20;10(51):eadn7540. doi: 10.1126/sciadv.adn7540. Epub 2024 Dec 18. Sci Adv. 2024. PMID: 39693439 Free PMC article.
-
Cell replacement and visual restoration by retinal sheet transplants.Prog Retin Eye Res. 2012 Nov;31(6):661-87. doi: 10.1016/j.preteyeres.2012.06.003. Epub 2012 Jul 5. Prog Retin Eye Res. 2012. PMID: 22771454 Free PMC article. Review.
-
Precise Correction of the Pde6b-L659P Mutation Causing Retinal Degeneration with Minimum Bystander Editing by Advanced Genome Editing Tools.Research (Wash D C). 2025 Jul 2;8:0770. doi: 10.34133/research.0770. eCollection 2025. Research (Wash D C). 2025. PMID: 40607323 Free PMC article.
-
Testing Visual Function by Assessment of the Optomotor Reflex in Glaucoma.Methods Mol Biol. 2025;2858:219-227. doi: 10.1007/978-1-0716-4140-8_18. Methods Mol Biol. 2025. PMID: 39433679
References
-
- An GJ, Asayama N, Humayun MS, Weiland J, Cao J, Kim SY, Grebe R, de Juan E, Jr, Sadda S. Ganglion cell responses to retinal light stimulation in the absence of photoreceptor outer segments from retinal degenerate rodents. Curr Eye Res. 2002;24:26–32. - PubMed
-
- Chang B, Hawes NL, Hurd RE, Davisson MT, Nusinowitz S, Heckenlively JR. Retinal degeneration mutants in the mouse. Vision Res. 2002;42:517–525. - PubMed
-
- Douglas RM, Alam NM, Silver BD, McGill TJ, Tschetter WW, Prusky GT. Independent visual threshold measurements in the two eyes of freely moving rats and mice using a virtual-reality optokinetic system. Vis Neurosci. 2005;22:677–684. - PubMed
Publication types
MeSH terms
Substances
Grants and funding
LinkOut - more resources
Full Text Sources
Miscellaneous
