. 2010 Oct 1;52(4):1401-9.
doi: 10.1016/j.neuroimage.2010.05.016. Epub 2010 May 20.

V1 is not uniquely identified by polarity reversals of responses to upper and lower visual field stimuli

Affiliations

V1 is not uniquely identified by polarity reversals of responses to upper and lower visual field stimuli

Justin M Ales et al. Neuroimage. .

Abstract

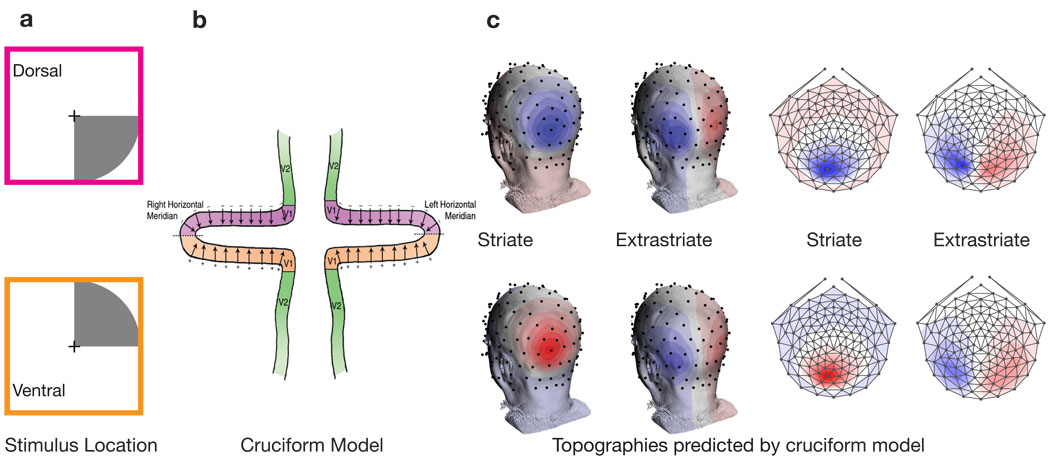
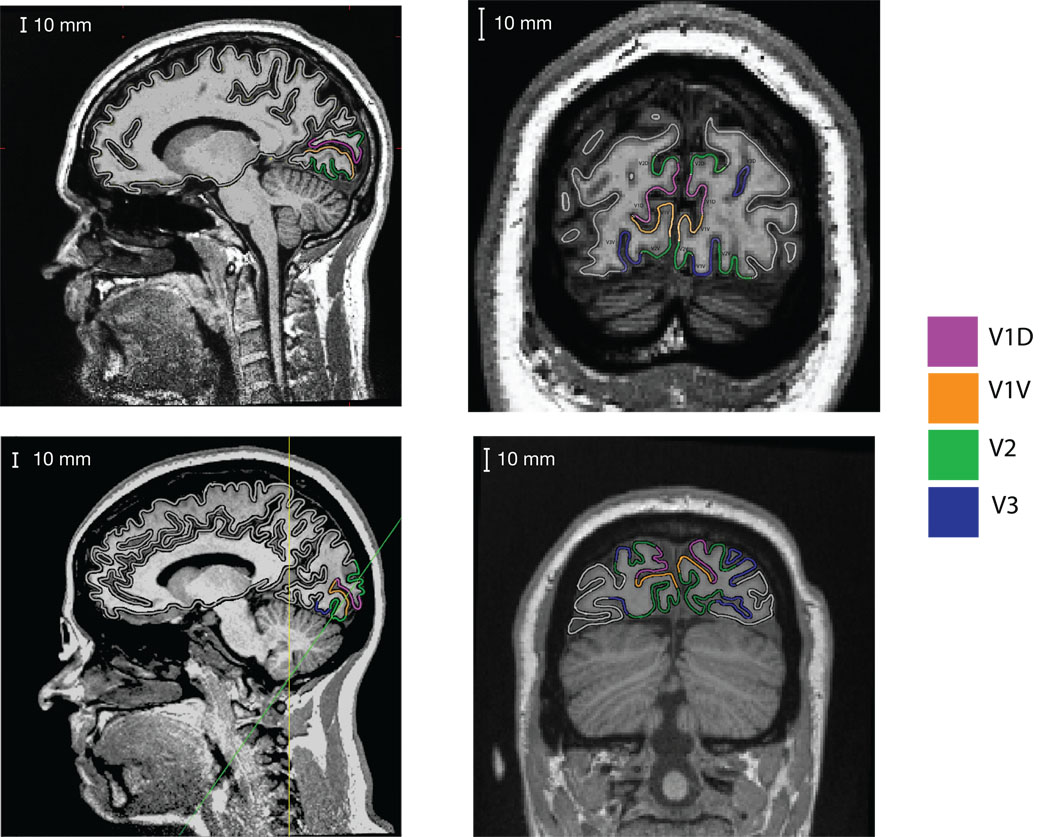
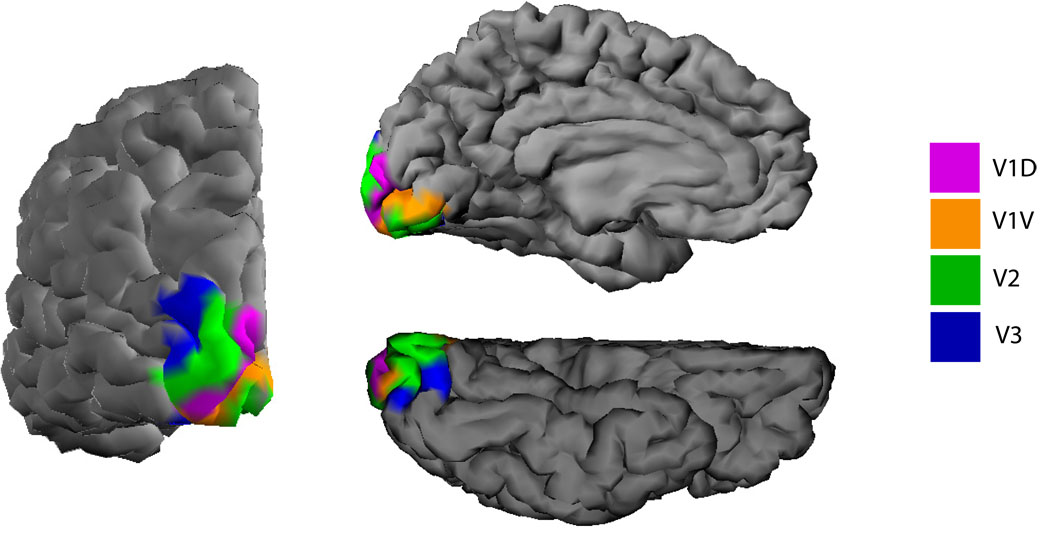
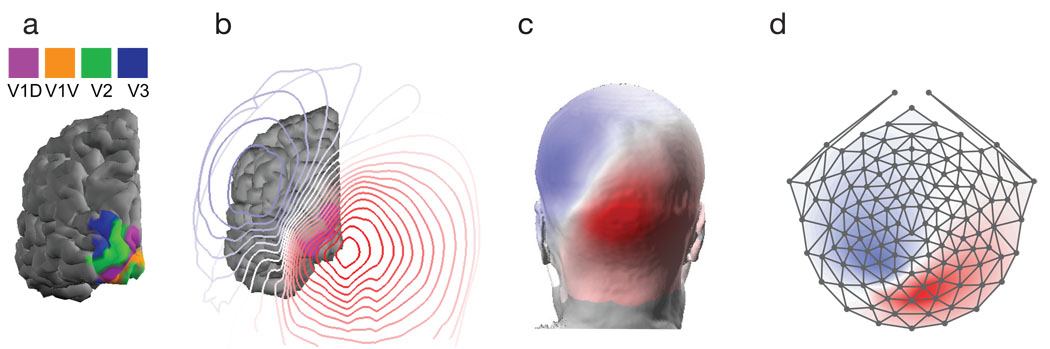
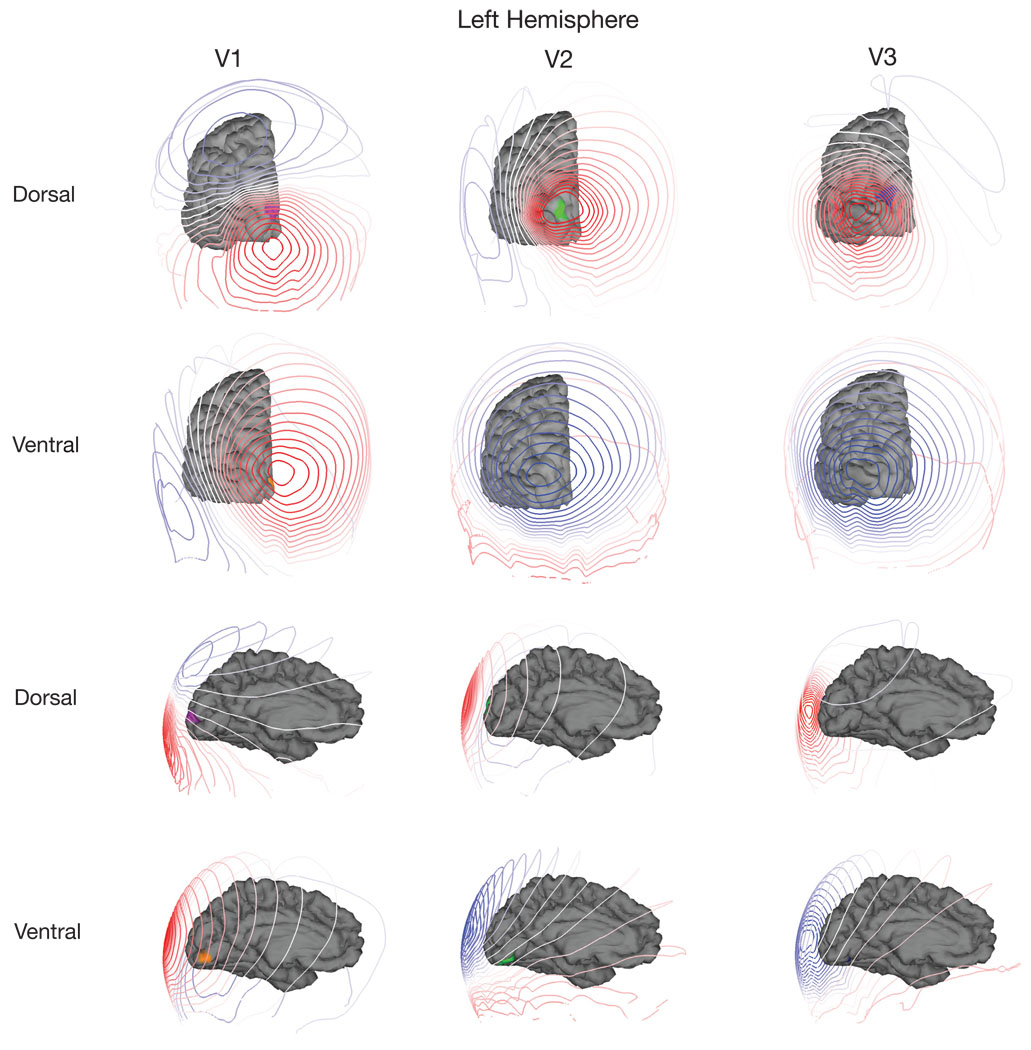
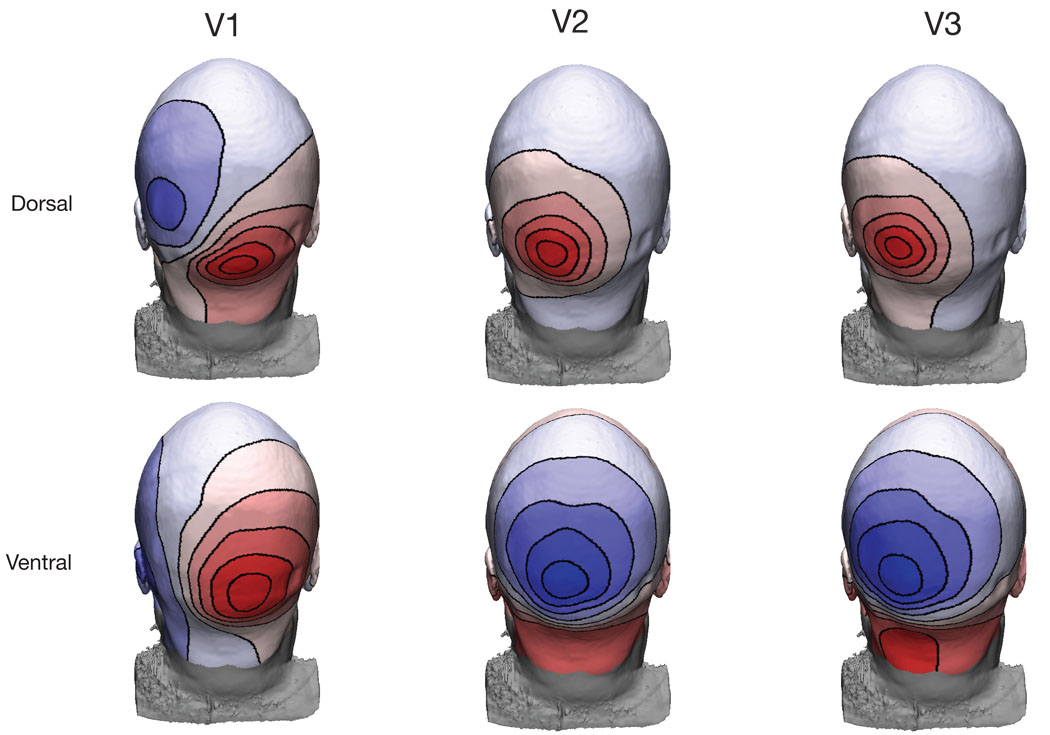
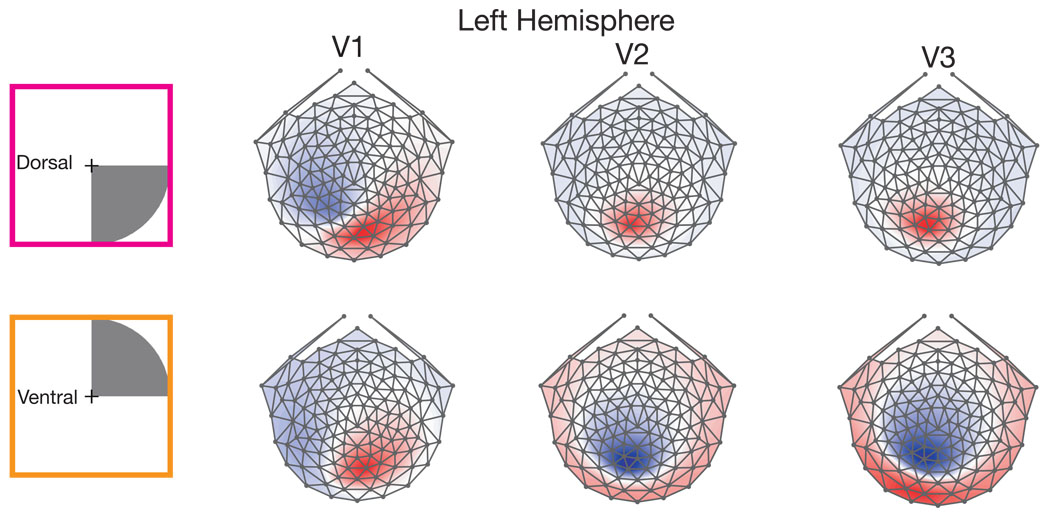
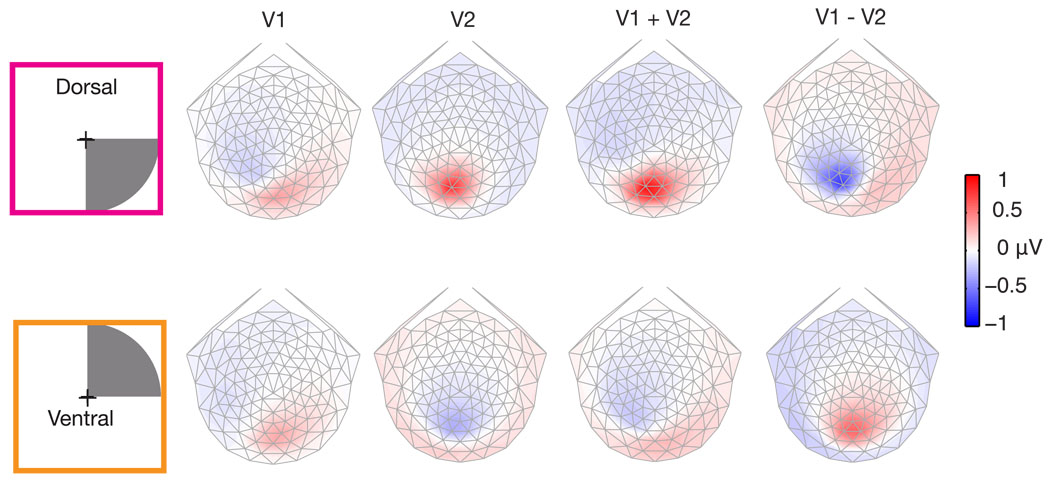
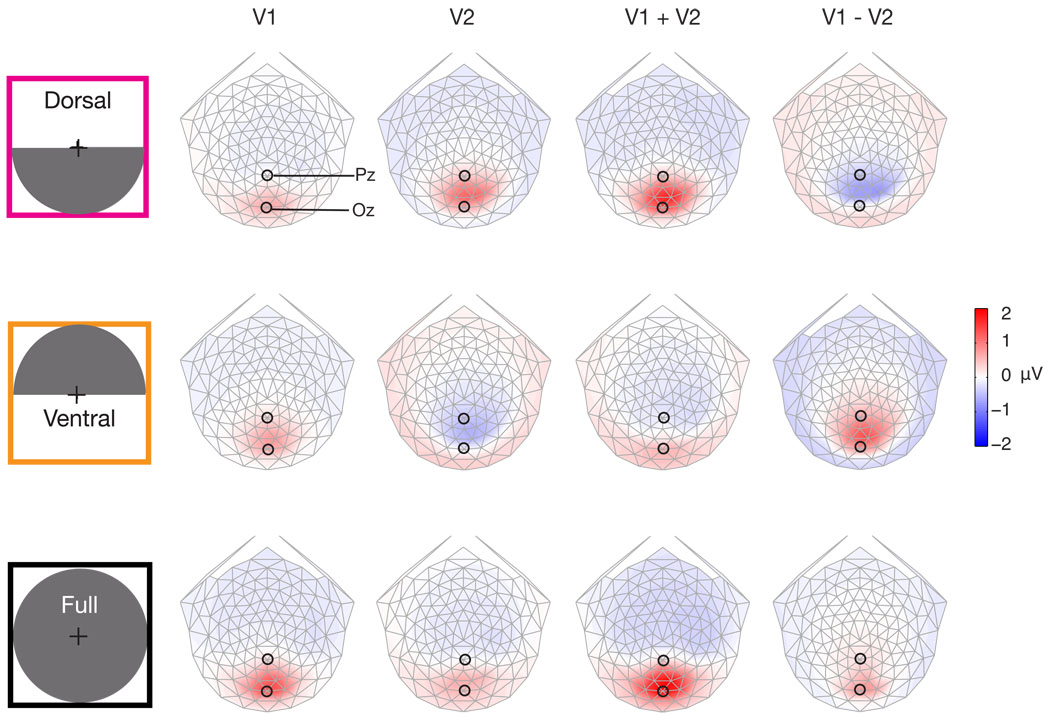
The cruciform hypothesis states that if a visual evoked potential component originates in V1, then stimuli placed in the upper versus lower visual fields will generate responses with opposite polarity at the scalp. This diagnostic has been used by many studies as a definitive marker of V1 sources. To provide an empirical test of the validity of the cruciform hypothesis, we generated forward models of cortical areas V1, V2 and V3 that were based on realistic estimates of the 3-D shape of these areas and the shape and conductivity of the brain, skull and scalp. Functional MRI was used to identify the location of early visual areas and anatomical MRI data was used to construct detailed cortical surface reconstructions and to generate boundary element method forward models of the electrical conductivity of each participant's head. These two data sets for each subject were used to generate simulated scalp activity from the dorsal and ventral subdivisions of each visual area that correspond to the lower and upper visual field representations, respectively. The predicted topographies show that sources in V1 do not fully conform to the cruciform sign-reversal. Moreover, contrary to the model, retinotopic visual areas V2 and V3 show polarity reversals for upper and lower field stimuli. The presence of a response polarity inversion for upper versus lower field stimuli is therefore an insufficient criterion for identifying responses as having originated in V1.


Figures

Figure 1
Figure 1
The upper plot in panel a) shows a lower visual field stimulus that will activate dorsal visual areas, while the lower plot shows an upper visual field stimulus that will activate ventral areas. Panel b) depicts the cruciform model of the anatomically organization of V1 and V2. The arrows in V1 represent predicted source orientations. This model predicts sources in V1 flipping orientation while V2 source maintain a consist orientation. The predicted topographies of this model are shown in panel c). The top row corresponds to sources in dorsal areas, while the bottom row corresponds to ventral areas. The topography simulations were realized by placing sources in V1 and V2 with orientations as specified by the cruciform model in panel b). Panel d) shows a flattened representation of the topographies in panel c).
Figure 2
Figure 2
MRI scans with visual areas V1, V2 and V3 labeled. Data from two participants are shown on the two rows. The first column shows a sagittal slice of both subjects. In this slice V1 is seen to localize to the calcarine sulcus, with V2 presenting both above and below. The second column contains a coronal slice for the first subject. The participant displays a complicated asymmetric folding pattern in the calcarine, with the left hemisphere showing an “s” curve, and the right hemisphere having a flattened bottom. For the second participant in the bottom row, an oblique slice taken perpendicular to the calcarine sulcus is displayed (indicated by the green line on the sagittal slice). This participant displays a calcarine sulcus that conforms more closely to the cruciform model, but also demonstrates how extrastriate areas V2 and V3 do not conform to the model since they also have opposite surface orientations. The anatomy of these subjects illustrates the heterogeneity of the calcarine sulcus.
Figure 3
Figure 3
A rendering of the left hemisphere mid-gray surface with visual areas labeled. The left is a view of the posterior surface, the upper right is a view of the medial wall, and the lower right is a view of the ventral surface.
Figure 4
Figure 4
In panel a) is the cortical surface with visual areas labeled. In b) there are contour lines corresponding to the potential on the scalp from a simulated source. Panel c) shows how these contours appear on the scalp. Panel d) plots the scalp topography as a flattened representation.
Figure 5
Figure 5
Predicted topographic components early visual areas in an individual subject. Each plot contains the results of simulating a uniform source in a ring ranging from 3–4 degrees eccentricity in a single visual area. The visual areas are color-coded the same as in Figure 3. The topographies in V1 do not full invert, but appear to rotate about 90 degrees, resulting in only a few locations showing polarity flips. The V2 and V3 sources exhibit many places where voltages completely reverse polarity for sources in their dorsal versus ventral divisions.
Figure 6
Figure 6
Predicted scalp topographies from early visual areas in a single participant. Each plot contains the results of simulating a uniform source in a single visual area. Each colormap is scaled separately to highlight the shape of the topography. The topographies in V1 do not full invert, but appear to rotate about 90 degrees, resulting in only a few locations showing polarity flips. While the V2 and V3 sources exhibit many places where voltages completely reverse polarity.
Figure 7
Figure 7
Simulated topographies averaged over 12 participants in the study. A schematic of the simulated 4 degree radius quadrant stimulus is shown on the far left. The same pattern as demonstrated by the individual subject in Figure 6 appears on the cross subject average. The topographies in V1 do not full invert, but appear to rotate about 90 degrees, resulting in only a few locations showing polarity flips. While the V2 and V3 sources exhibit many places where voltages completely reverse polarity.
Figure 8
Figure 8
Simulated linear combinations of V1 and V2. The upper row shows topographies for a lower right visual field (dorsal left hemisphere) source. Note the color scale, unlike previous figures each topography has an identical color scaling. Dorsal V2 produces the largest scalp voltages. Linear combinations of V1 and V2 have significant contributions from V2.
Figure 9
Figure 9
Simulated linear combinations of V1 and V2 for bilateral stimuli. The first row contains topographies for a bilateral lower visual field (dorsal) stimulus. The middle row contains simulations for a bilateral upper visual field (ventral) stimulus. The bottom row contains the topographies for a full field stimulus. Note all topographies are identically scaled, and the color scaling is twice that of Figure 8. The only time the scalp voltage for a V1 source is larger than V2 is for the full field stimulus. For bilateral upper/lower visual field stimuli V1 has a consistent polarity at between Pz and Oz, while V2 reverses polarity.

Comment in

References

    1. Ales J, Carney T, Klein SA. The folding fingerprint of visual cortex reveals the timing of human V1 and V2. Neuroimage. 2009 - PMC - PubMed
    1. Brindley GS, Lewin WS. The visual sensations produced by electrical stimulation of the medial occipital cortex. J Physiol. 1968;194:54–55. - PubMed
    1. Brookes MJ, Zumer JM, Stevenson CM, Hale JR, Barnes GR, Vrba J, Morris PG. Investigating spatial specificity and data averaging in MEG. Neuroimage. 2010;49:525–538. - PMC - PubMed
    1. Dale AM, Fischl B, Sereno MI. Cortical surface-based analysis. I. Segmentation and surface reconstruction. Neuroimage. 1999;9:179–194. - PubMed
    1. DeYoe EA, Carman GJ, Bandettini P, Glickman S, Wieser J, Cox R, Miller D, Neitz J. Mapping striate and extrastriate visual areas in human cerebral cortex. Proc Natl Acad Sci U S A. 1996;93:2382–2386. - PMC - PubMed

Publication types