. 2010 Sep;51(9):2642-54.
doi: 10.1194/jlr.M006080. Epub 2010 May 19.

Elevated hepatic fatty acid elongase-5 activity corrects dietary fat-induced hyperglycemia in obese C57BL/6J mice

Affiliations

Elevated hepatic fatty acid elongase-5 activity corrects dietary fat-induced hyperglycemia in obese C57BL/6J mice

Sasmita Tripathy et al. J Lipid Res. 2010 Sep.

Abstract

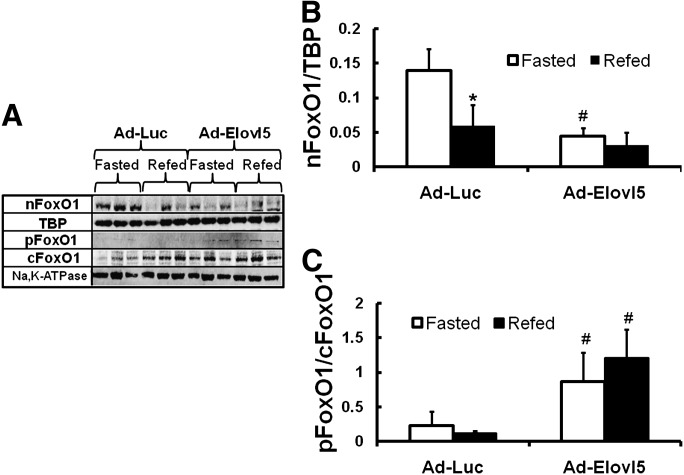
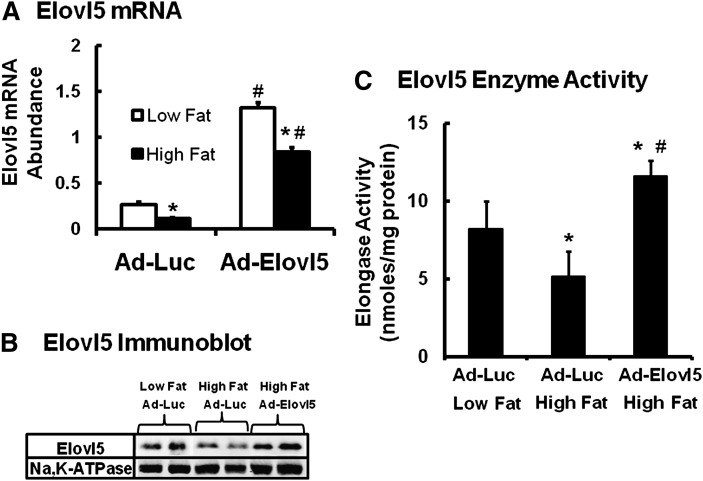
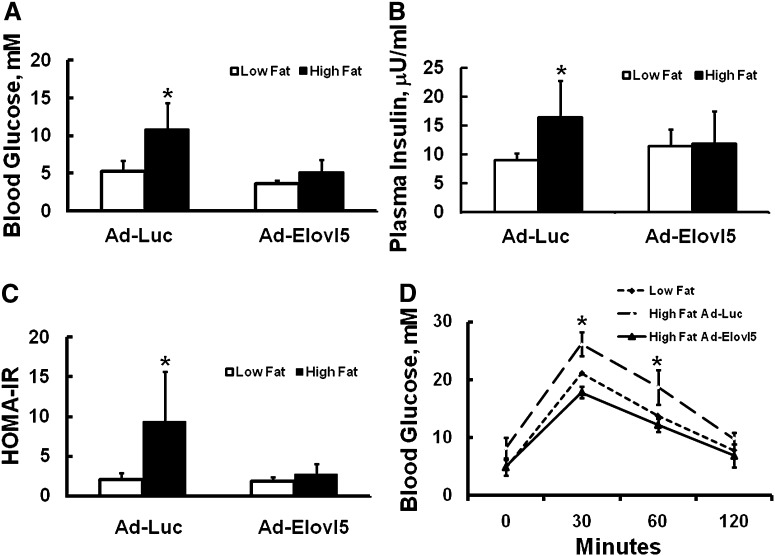
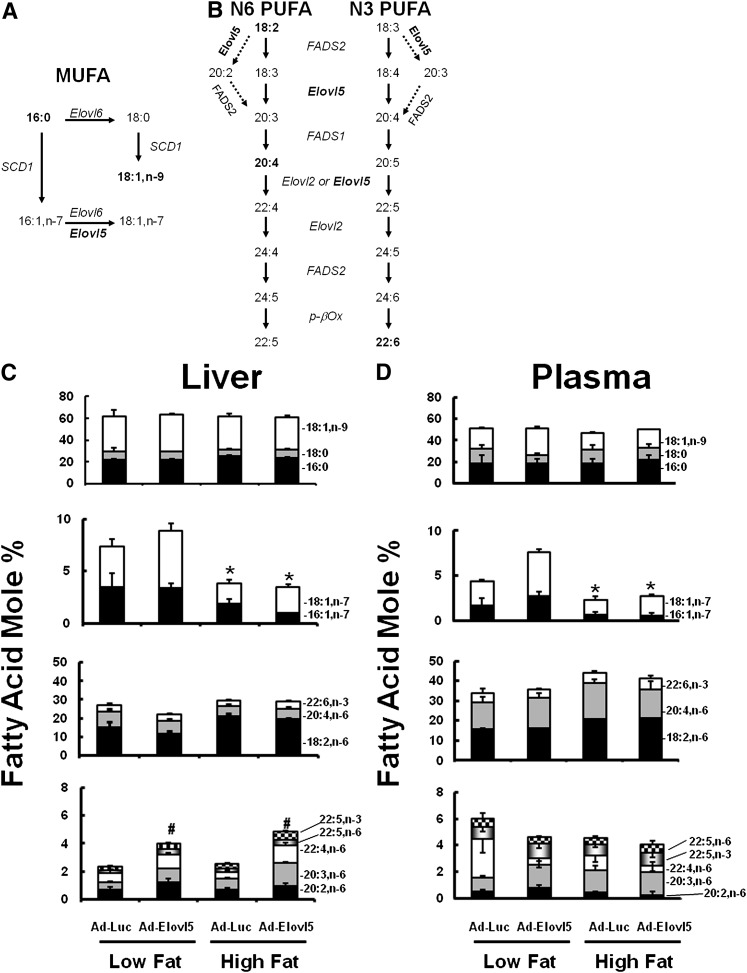
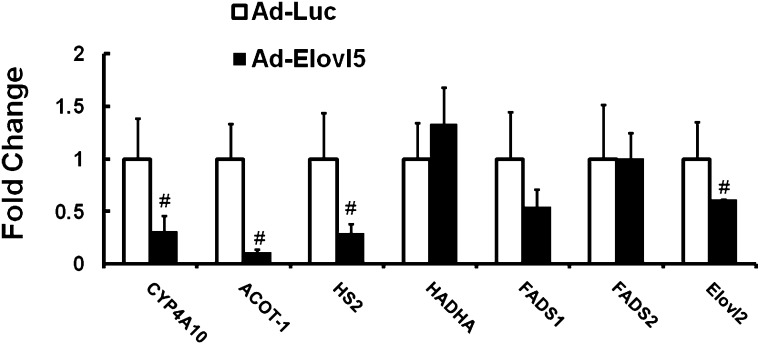
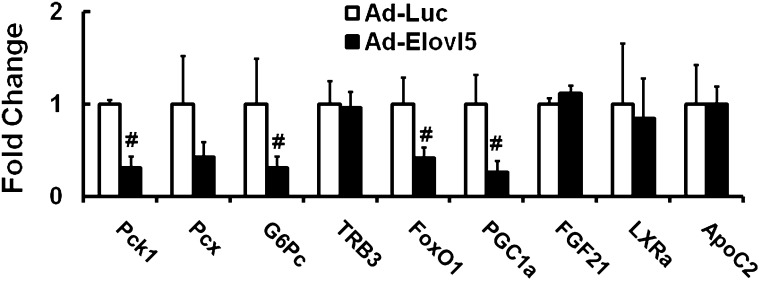
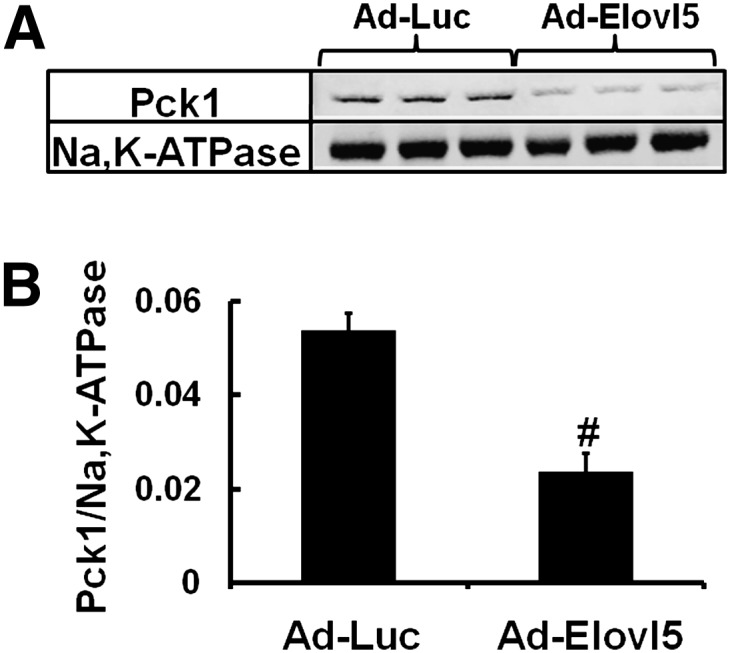
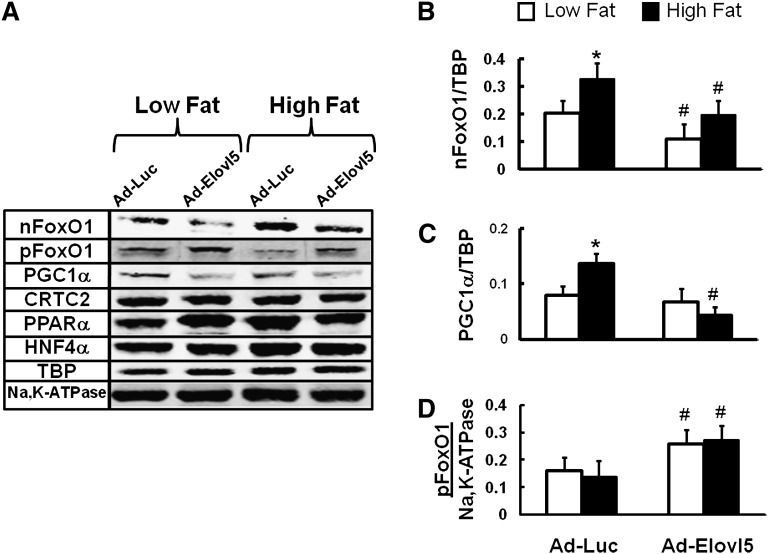
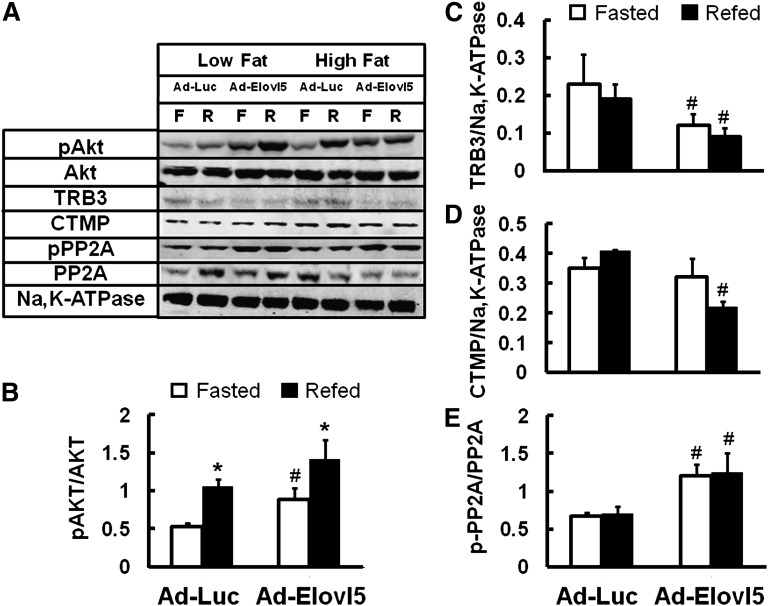
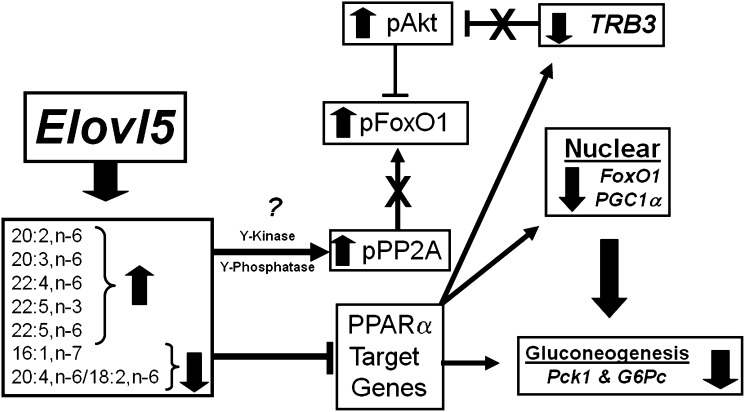
Elevated hepatic fatty acid elongase-5 (Elovl5) activity lowers blood glucose in fasted chow-fed C57BL/6J mice. As high-fat diets induce hyperglycemia and suppress hepatic Elovl5 activity, we tested the hypothesis that elevated hepatic Elovl5 expression attenuates hyperglycemia in high-fat-diet-induced obese mice. Increasing hepatic Elovl5 activity by a recombinant adenoviral approach restored blood glucose and insulin, HOMA-IR, and glucose tolerance to normal values in obese mice. Elevated Elovl5 activity increased hepatic content of Elovl5 products (20:3,n-6, 22:4,n-6) and suppressed levels of enzymes (Pck1, G6Pc) and transcription factors (FoxO1 and PGC1alpha, but not CRTC2) involved in gluconeogenesis. Effects of Elovl5 on FoxO1 nuclear abundance correlated with increased phosphorylation of FoxO1, Akt, and the catalytic unit of PP2A, as well as a decline in cellular abundance of TRB3. Such changes are mechanistically linked to the regulation of FoxO1 nuclear abundance and gluconeogenesis. These results show that Elovl5 activity impacts the hepatic abundance and phosphorylation status of multiple proteins involved in gluconeogenesis. Our findings establish a link between fatty acid elongation and hepatic glucose metabolism and suggest a role for regulators of Elovl5 activity in the treatment of diet-induced hyperglycemia.


Figures

Fig. 1.
Fig. 1.
Elevated hepatic Elovl5 activity suppresses FoxO1 nuclear content. The tissues samples used for the FoxO1 analysis were the same as those used in our previous study (10). Briefly, male C57BL/6J mice maintained on a chow diet (Purina 5001) were injected with Ad-Luc (control recombinant adenovirus) or Ad-Elovl5. Four days post injection animals were fasted overnight (see “Materials and Methods”). At 8:00 AM the next day, 1/2 of the mice were euthanized for blood and tissue recovery ("Fasted”). The remaining mice were fed chow (Purina 5001) and euthanized 4 h later ("Refed”). A: Hepatic nuclear and cytosolic (post-nuclear) proteins were prepared and levels of FoxO1, pFoxO1, TBP, and Na,K-ATPase were measured by immunoblotting (see “Materials and Methods”); three animals/group. B: TBP and Na,K-ATPase are loading controls. Levels of nuclear FoxO1 were normalized to TBP; i.e., nFoxO1/TBP. C: The level of cytosolic phosphorylated FoxO1 was normalized to total cytosolic FoxO1. Results are expressed as nFoxO1/TBP or pFoxO1/FoxO1, mean ± SD, n = 3. *P ≤ 0.05 fasted versus refed animals; #P ≤ 0.05 Ad-Luc- versus Ad-Elovl5-infected animals, ANOVA.
Fig. 2.
Fig. 2.
Hepatic Elovl5 mRNA, protein, and enzyme activity in C57BL/6J mice fed low- and high-fat diets. Mice were fed a low-fat diet (Research Diets D12450B, 10% calories as fat) or a high-fat diet (Research Diets, D12492, 60% calories as fat) ad lib for 12 weeks. After 11 weeks on the diet, mice in each group were infected with recombinant adenovirus expressing either luciferase (Ad-Luc) or Elovl5 (Ad-Elovl5). Five days later, mice were fasted overnight and euthanized the next day. Table 2 provides details on body weight, plasma, and liver parameters. Hepatic Elovl5 mRNA, protein, and enzyme activity used livers from mice fasted overnight (see “Materials and Methods”). A: Elovl5 mRNA abundance. The abundance of Elovl5 and cyclophilin mRNA in livers of fasted mice infected with Ad-Luc and Ad-Elovl5 was quantified by qRT-PCR (see “Materials and Methods”). Results are expressed as Elovl5 mRNA abundance relative to cyclophilin, mean ± SD, n = 8, *P ≤ 0.05 low fat versus high fat; #P ≤ 0.05 Ad-Luc versus Ad-Elovl5, ANOVA. B: Elovl5 immunoblot. Hepatic Elovl5 and Na,K-ATPase (loading control) protein was measured by immunoblotting (see “Materials and Methods”) (10). Hepatic protein extracts are from two separate mice per group. C: Elovl5 activity. Fatty acid elongase activity was measured using microsomes isolated from livers of fasted mice. 18:3,n6-CoA was used as substrate; 18:3,n6-CoA is a specific substrate for Elovl5 (see “Materials and Methods”) (10). Results are expressed as elongase activity nmoles 14C-malonyl CoA incorporated in to fatty acids/mg protein, mean ± SD, 8 animals/group (7, 10, 54). *P ≤ 0.05 low fat versus high fat; #P ≤ 0.05 Ad-Luc versus Ad-Elovl5, ANOVA.
Fig. 3.
Fig. 3.
Blood glucose, plasma insulin, HOMA-IR, and glucose tolerance test in mice fed low- and high-fat diets. Male C57BL/6J mice were maintained on low-fat (Research Diets D12450B, 10% calories as fat) or high-fat diets (Research Diets, D12492, 60% calories as fat) ad lib for 12 weeks. After 11 weeks on the diets, mice were infected with Ad-Luc or Ad-Elovl5. Five days later, mice were fasted overnight (6 PM to 8 AM; see “Materials and Methods”) and euthanized at 8:00 AM the next day for blood and tissue collection. Blood glucose (mM) (A) and plasma insulin (μU/ml) (B) were measured; these values were used to calculate HOMA-IR (C) [HOMA-IR = (G × I)/22.5]. Results are expressed as mean ± SD, n = 4–8; *P ≤ 0.05 Ad-Luc versus Ad-Elovl5, ANOVA. D: Glucose tolerance test. Mice on the high-fat diet for 11 weeks were injected with Ad-Luc ("High Fat Ad-Luc”) or Ad-Elovl5 ("High Fat Ad-Elovl5”) as described above. Mice on the low-fat diet for 11 weeks were not injected with adenovirus ("Low Fat”) and served as a reference for a normal glucose tolerance test. Three days after infection, all mice were fasted overnight (see “Materials and Methods”). The next day, blood glucose was measured at 8 AM; all fasted mice were injected with glucose (2 mg/kg) and blood glucose was measured 30, 60, and 120 min afterward (see “Materials and Methods”). Results are expressed as blood glucose (mM), mean ± SD, four animals/group; *P ≤ 0.05 Ad-Luc versus Ad-Elovl5, ANOVA. The area under the curve was calculated using Sigmaplot v.10 trapezoid rule. The values are 1581 ± 168, 2044 ± 91, 1404 ± 132 mM glucose × min; for low-fat, high-fat Ad-Luc, and high-fat Ad-Elovl5, respectively. The high-fat Ad-Luc group was significantly different from the low-fat and high-fat Ad-Elovl5 groups; P ≤ 0.05, ANOVA.
Fig. 4.
Fig. 4.
Effect of dietary fat and Elovl5 on hepatic and plasma fatty acid composition. Pathways for MUFA (A) and n-6 and n-3 PUFA (B) synthesis. Oleic (18:1,n-9), linoleic (18:2,n-6), arachidonic (20:4,n-6), and docosahexaenoic acid (22:6,n-3) (bolded) are the major fatty acids accumulating in liver. Fatty acid composition of mouse liver (C) and plasma (D) were measured on fasted mice. Lipids were extracted, saponified, converted to fatty acid methyl esters, and quantified by gas chromatography (see “Materials and Methods”). Results are expressed as fatty acid mole %, mean ± SD, four mice/group. Statistical differences for the cumulative amount of fatty acids (e.g., 16:1,n-7 plus 18:1,n-7 or 20:2,n-6, 20:3,n-6, 22:4,n-6, 22:6,n-6, 22:5,n-3) are reported in panels C and D; *P ≤ 0.05 low fat versus high fat; #P ≤ 0.05 Ad-Luc versus Ad-Elovl5, ANOVA.
Fig. 5.
Fig. 5.
Effect of Elovl5 on PPARα-regulated gene expression in mice fed a high-fat diet. RNA was extracted from livers of fasted mice maintained on the high-fat diet and infected with either Ad-Luc or Ad-Elovl5 (see “Materials and Methods”). Transcript abundance was assayed by qRT-PCR (10) using primers listed in Table 1. Results are normalized to the transcript abundance in Ad-Luc-infected mice maintained on the high-fat diet and fasted overnight. Results are presented as fold change induced by Ad-Elovl5, mean ± SD, four mice/group. White bars indicate Ad-Luc-infected mice. Black bars indicate Ad-Elovl5-infected mice. #P ≤ 0.05, Ad-Luc versus Ad-Elovl5, Student's t-test.
Fig. 6.
Fig. 6.
Effect of elevated Elovl5 activity on mRNA levels of proteins involved in gluconeogenesis. RNA was extracted from livers of fasted mice fed the high-fat diet and infected with either Ad-Luc or Ad-Elovl5, as described (see . Transcript abundance was assayed by qRT-PCR (10) using primers listed in Table 1. Results are normalized to the transcript abundance in Ad-Luc-infected mice maintained on the high-fat diet and fasted overnight. Results are presented as fold change induced by Ad-Elovl5, mean ± SD, four mice/group. White bars indicate Ad-Luc-infected mice. Black bars indicate Ad-Elovl5-infected mice. #P < 0.05, Ad-Luc versus Ad-Elovl5, Student's t-test.
Fig. 7.
Fig. 7.
Elevated Elovl5 activity suppresses cytosolic Pck1 abundance. Mouse liver postnuclear (cytosolic) extracts were prepared (10) from fasted mice maintained on the high-fat diet and infected with either Ad-Luc or Ad-Elovl5. Protein abundance of Pck1 and Na,K-ATPase was measured by immunoblotting and quantified using a LiCor Odyssey (10). A: Representative immunoblots for cytosolic Pck1 and Na,K-ATPase; Na,K-ATPase is the loading control; three mice/group. B: Quantified results for cytosolic Pck1 were normalized to Na,K-ATPase; extracts were derived from fasted mice maintained on the high-fat diet and infected with either Ad-Luc or Ad-Elovl5. Results are expressed as mean ± SD, six mice/group. #P ≤ 0.05 Ad-Luc versus Ad-Elovl5, Student's t-test. The results are representative of two separate experiments.
Fig. 8.
Fig. 8.
Nuclear abundance and phosphorylation status of transcription factors controlling gluconeogenesis. Mouse liver nuclear and postnuclear (cytosolic) extracts were prepared (10) from fasted mice maintained on the low- or high-fat diet and infected with either Ad-Luc or Ad-Elovl5. Protein abundance was measured by immunoblotting, and images were quantified using a LiCor Odyssey (10). A: Representative immunoblots for nuclear FoxO1 (nFoxO1), phosphorylated FoxO1 [cytosolic] (pFoxO1), PGC1α, CRTC2, PPARα, HNF4α, and TBP; extracts from one mouse/group. B-D: Quantified immunoblots for FoxO1, PGC1α, and pFoxO1 (eight mice/group). FoxO1 and PGC1α were normalized to TBP; pFoxO1 was normalized to Na,K-ATPase. Extracts are from mice fed the low-fat (white bars) or high-fat (black bars) diet. All extracts were obtained from mice fasted overnight (see “Materials and Methods”). Results are expressed as mean ± SD, eight mice/group. *P < 0.05 low fat versus high fat; #P ≤ 0.05 Ad-Luc versus Ad-Elovl5, ANOVA.
Fig. 9.
Fig. 9.
Abundance and phosphorylation status of hepatic proteins involved in cell signaling. Mouse liver cytosolic extracts were prepared (10) from fasted ("F”) and refed ("R”) mice maintained on low- or high-fat diet and infected with either Ad-Luc or Ad-Elovl5. Protein abundance was measured by immunoblotting, and images were quantified using a LiCor Odyssey (10). A: Representative immunoblots for cytosolic phosphorylated Akt (pAkt) and total Akt (Akt), TRB3, CTMP, phosphorylated PP2A catalytic unit (pPP2A), total PP2A catalytic units (PP2A), and Na,K-ATPase (a loading control); extracts from one mouse/group. B-D: Quantified results for the phosphorylation status of Akt [i.e., pAkt normalized to total Akt (pAkt/Akt)], total TRB3 normalized to Na,K-ATPase (TRB3/Na,K-ATPase), CTMP normalized to Na,K-ATPase, and the phosphorylation status of PP2A catalytic unit [i.e., pPP2A normalized to total PP2A (pPP2A/PP2A)]. Quantified results are from mice maintained on the high-fat diet; mice were fasted (white bars) or refed (black bars) as described (see “Materials and Methods”). Results are expressed as mean ± SD, eight mice/group. *P < 0.05 low fat versus high fat; #P ≤ 0.05 Ad-Luc versus Ad-Elovl5, ANOVA.
Fig. 10.
Fig. 10.
Tentative model for Elovl5 effects on hepatic function. See text for description.

References

    1. Cinti D. L., Cook L., Nagi M. N., Suneja S. K. 1992. The fatty acid chain elongation system of mammalian endoplasmic reticulum. Prog. Lipid Res. 31: 1–51. - PubMed
    1. Jakobsson A., Westerberg R., Jacobsson A. 2006. Fatty acid elongases in mammals: their regulation and role in metabolism. Prog. Lipid Res. 45: 237–249. - PubMed
    1. Leonard A. E., Pereira S. L., Sprecher H., Huang Y. S. 2004. Elongation of long-chain fatty acids. Prog. Lipid Res. 43: 36–54. - PubMed
    1. Denic V., Weissman J. S. 2007. A molecular caliper mechanism for determining very long-chain fatty acid length. Cell. 130: 663–677. - PubMed
    1. Moon Y. A., Horton J. D. 2003. Identification of two mammalian reductases involved in the two-carbon fatty acyl elongation cascade. J. Biol. Chem. 278: 7335–7343. - PubMed

Publication types

MeSH terms