. 2010 Jul;20(7):972-80.
doi: 10.1101/gr.101535.109. Epub 2010 May 20.

Chromatin and sequence features that define the fine and gross structure of genomic methylation patterns

Affiliations

Chromatin and sequence features that define the fine and gross structure of genomic methylation patterns

John R Edwards et al. Genome Res. 2010 Jul.

Abstract

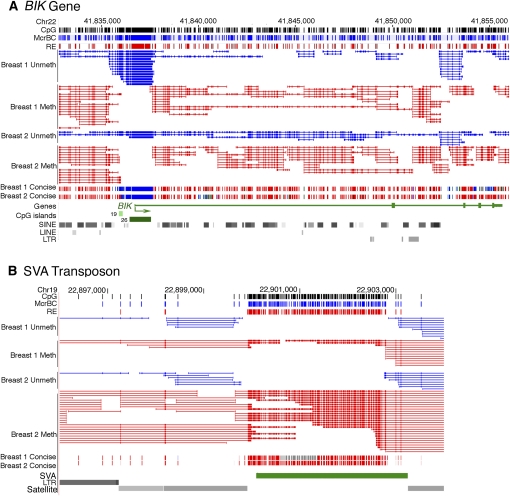
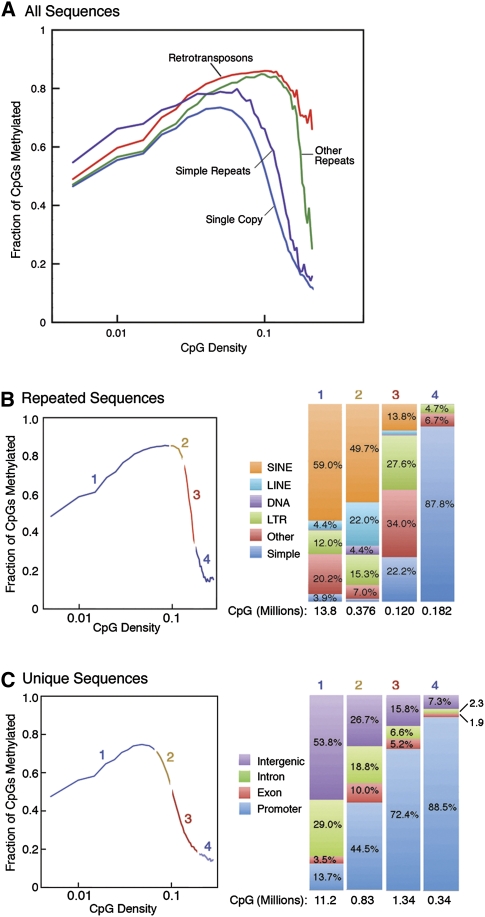
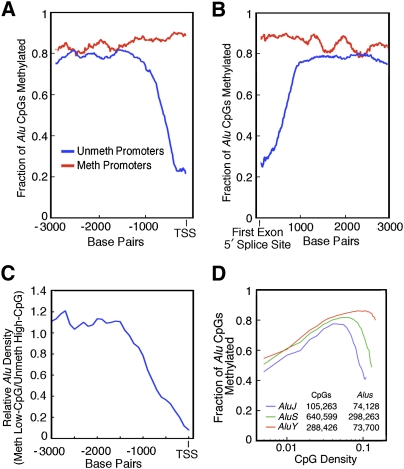
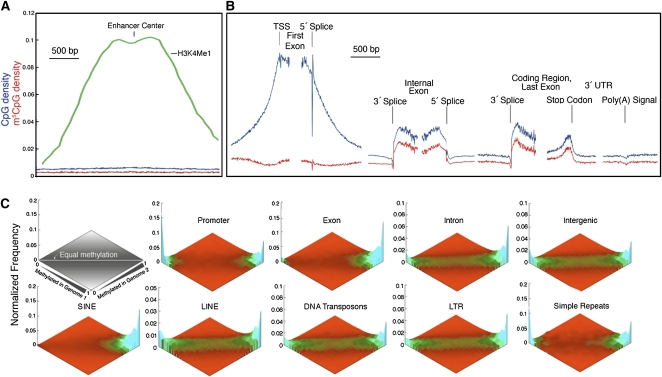
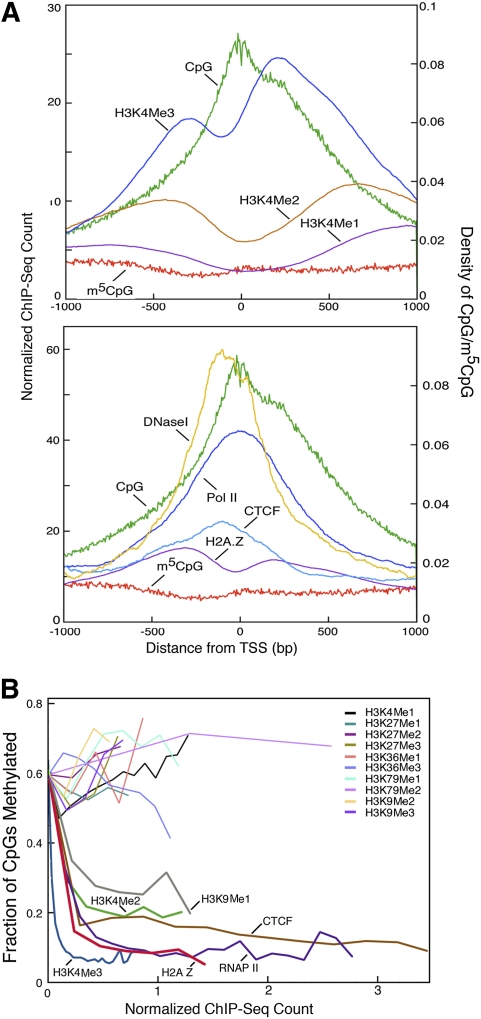
Abnormalities of genomic methylation patterns are lethal or cause disease, but the cues that normally designate CpG dinucleotides for methylation are poorly understood. We have developed a new method of methylation profiling that has single-CpG resolution and can address the methylation status of repeated sequences. We have used this method to determine the methylation status of >275 million CpG sites in human and mouse DNA from breast and brain tissues. Methylation density at most sequences was found to increase linearly with CpG density and to fall sharply at very high CpG densities, but transposons remained densely methylated even at higher CpG densities. The presence of histone H2A.Z and histone H3 di- or trimethylated at lysine 4 correlated strongly with unmethylated DNA and occurred primarily at promoter regions. We conclude that methylation is the default state of most CpG dinucleotides in the mammalian genome and that a combination of local dinucleotide frequencies, the interaction of repeated sequences, and the presence or absence of histone variants or modifications shields a population of CpG sites (most of which are in and around promoters) from DNA methyltransferases that lack intrinsic sequence specificity.


Figures

Figure 1.
Figure 1.
High-resolution genome-wide methylation profiling and genome-wide DNA methylation trends. (A) Browser view of Methyl-MAPS data from the genomic region spanning the BIK gene. Individual mapped sequence reads are shown in the top raw data tracks. Red sequences were resistant to methylation-sensitive restriction endonucleases (RE) and are therefore methylated. Blue sequences were resistant to the methylation-dependent McrBC complex and are unmethylated. Tick marks in both tracks along the top of the figure and within each sequence indicate locations of individual RE and McrBC recognition sequences. Methylation data is also presented in a concise view, where each CpG is assigned a methylation score from the ratio of methylated to total (unmethylated and methylated) sequences covering each CpG site. The bulk of the BIK gene is methylated, while the CpG-rich promoter is unmethylated. (B) Methylation of the SVA retrotransposon in a repeat-rich region of chr 19. While the CpG density is comparable to that of the CpG island of the BIK gene shown in A, the SVA retrotransposon is densely methylated.
Figure 2.
Figure 2.
Relationship of CpG density and methylation for repeated and unique sequences. (A) CpG methylation is plotted as a function of CpG density for four distinct genomic compartments (single copy, retrotransposons, simple repeats, and other repeats). Approximately 50% of the CpGs in the genome are contained in both repeats (B) and unique sequences (C). Each curve is divided into four CpG density regions; the CpG composition of each is shown in the bar charts on the right. The large majority of CpGs are contained in region 1 in both plots (A, 96%; B, 81.9%). (B) The majority of low-CpG density CpGs are contained in SINE and LINE elements, while the highly unmethylated high-density CpGs are primarily found in simple repeats. (C) The majority of low-CpG density CpGs are contained in intergenic and intronic unique sequences, while the highly unmethylated high-density CpGs are primarily found in promoter-associated regions.
Figure 3.
Figure 3.
Relationship between CpG methylation at Alu retrotransposons and proximity to methylated and unmethylated promoters. Alu methylation is plotted as a function of distance from the TSS (A) and to the 3′ splice site of the first exon (B) of methylated (red) and unmethylated (blue) first exons. When near unmethylated first exons, Alu elements are also unmethylated. Alu methylation correlates with first-exon methylation when Alus are within ∼1 kb of the TSS or 3′ edge of the first exon. (C) Negative selection of Alu elements near unmethylated promoters. The ratio of the fraction of methylated promoters with Alus near the first exon to the fraction of unmethylated promoters with Alus near the first exon is plotted as a function of the distance to the TSS. This suggests that unmethylated Alus near promoters are deleterious and are lost from the population by selection. (D) The methylation status of the three major classes of Alu retrotransposons. Note that AluY (the only active Alu in the human genome) remains heavily methylated, even at very high CpG densities.
Figure 4.
Figure 4.
(A,B) CpG distributions and methylation patterns in human genes. m5CpG and CpG densities are shown in relation to enhancers (A), TSS, exon splice sites, stop codons, and poly(A) sites (B). Note spikes in CpG and m5CpG densities at the 5′ and 3′ ends of exons and internal to the stop codon in the last exon. (C) Comparison of methylation patterns in normal breast tissue from two individuals. Methylation status of each CpG with high coverage is computed for each sample. The frequency of such points is then plotted as a function of the methylation score for each sample. Heat map indicates frequency. Values in the left corner are unmethylated in both samples. Values in the right corner are methylated in both samples. Values along the horizontal are equivalently methylated in each sample. Some sequence classes have a wide range of methylation states, such as intronic and intergenic single-copy sequences and LINEs, LTRs, and DNA transposons. Other classes such as SINEs, exons, simple repeats, and promoters are polarized.
Figure 5.
Figure 5.
Relationship between DNA methylation, histone modification, chromatin proteins, and nucleosome positioning. (A) m5CpG and CpG densities, ChIP-seq scores, and DNase hypersensitivity scores are plotted relative to promoter TSSs for 16,181 RefSeq genes. (B) CpG methylation plotted as a function of histone modifications, chromatin factors, and RNA polymerase II occupancy. Note the strong negative relationship between DNA methylation and density of H3K4me3 and H2A.Z and the lack of a strong association between DNA methylation status and most histone modifications.

References

    1. Barski A, Cuddapah S, Cui K, Roh TY, Schones DE, Wang Z, Wei G, Chepelev I, Zhao K 2007. High-resolution profiling of histone methylations in the human genome. Cell 129: 823–830 - PubMed
    1. Bell AC, Felsenfeld G 2000. Methylation of a CTCF-dependent boundary controls imprinted expression of the Igf2 gene. Nature 405: 482–488 - PubMed
    1. Boyle AP, Davis S, Shulha HP, Meltzer P, Margulies EH, Weng Z, Furey TS, Crawford GE 2008. High-resolution mapping and characterization of open chromatin across the genome. Cell 132: 311–317 - PMC - PubMed
    1. Carmell MA, Girard A, van de Kant HJ, Bourc'his D, Bestor TH, de Rooij DG, Hannon GJ 2007. MIWI2 is essential for spermatogenesis and repression of transposons in the mouse male germline. Dev Cell 12: 503–514 - PubMed
    1. Collins FS, Weissman SM 1984. Directional cloning of DNA fragments at a large distance from an initial probe: A circularization method. Proc Natl Acad Sci 81: 6812–6816 - PMC - PubMed

Publication types

Associated data