. 2010 Sep;20(9):1262-70.
doi: 10.1101/gr.106419.110. Epub 2010 May 20.

High-throughput sequencing reveals extensive variation in human-specific L1 content in individual human genomes

Affiliations

High-throughput sequencing reveals extensive variation in human-specific L1 content in individual human genomes

Adam D Ewing et al. Genome Res. 2010 Sep.

Abstract

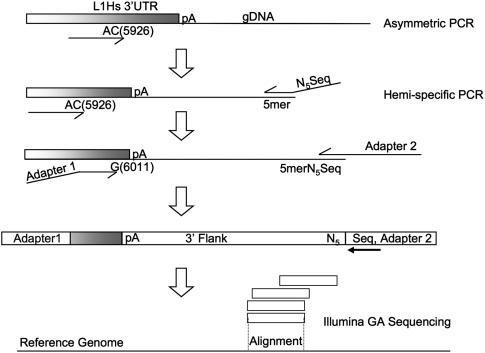
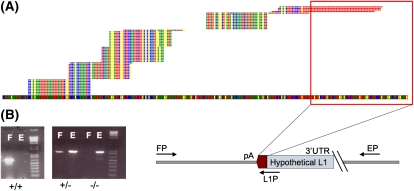
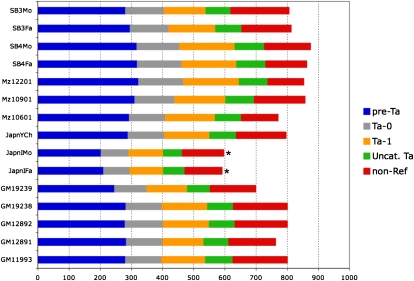
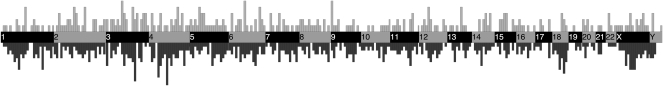
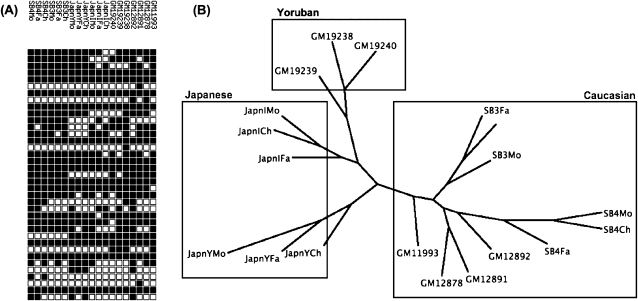
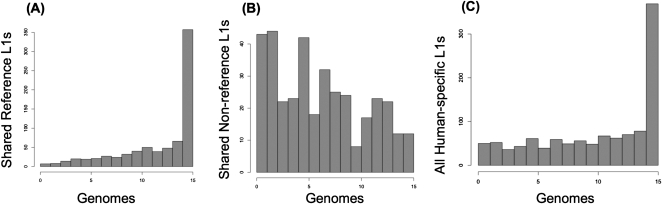
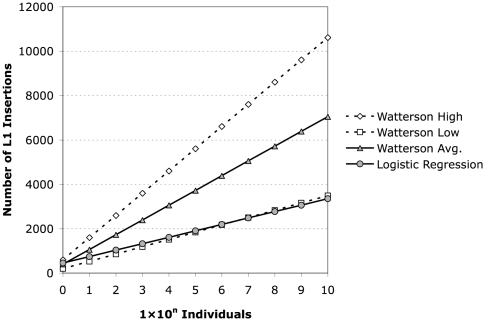
Using high-throughput sequencing, we devised a technique to determine the insertion sites of virtually all members of the human-specific L1 retrotransposon family in any human genome. Using diagnostic nucleotides, we were able to locate the approximately 800 L1Hs copies corresponding specifically to the pre-Ta, Ta-0, and Ta-1 L1Hs subfamilies, with over 90% of sequenced reads corresponding to human-specific elements. We find that any two individual genomes differ at an average of 285 sites with respect to L1 insertion presence or absence. In total, we assayed 25 individuals, 15 of which are unrelated, at 1139 sites, including 772 shared with the reference genome and 367 nonreference L1 insertions. We show that L1Hs profiles recapitulate genetic ancestry, and determine the chromosomal distribution of these elements. Using these data, we estimate that the rate of L1 retrotransposition in humans is between 1/95 and 1/270 births, and the number of dimorphic L1 elements in the human population with gene frequencies greater than 0.05 is between 3000 and 10,000.


Figures

Figure 1.
Figure 1.
Hemi-specific PCR scheme to amplify 3′ flanking regions of human-specific LINE-1 insertion sites. The first five cycles of PCR enrich for sequences containing human-specific L1 sequences via primer extension with the single primer pictured above. The AC and G nucleotides in the primers for L1 are diagnostic for the human-specific subfamily for this element. After enrichment for human-specific L1 flanks, a degenerate primer is added that has a specified 5-mer at the 3′ end preceded by five degenerate bases (NNNNN) and a sequencing primer used for the Illumina Genome Analyzer. Eight different reactions are performed, each with a different specified 5mer. The next round of PCR enriches for human-specific L1 3′ flanks with another primer complementary to the L1 and adds the necessary adapter sequences via primer overhangs. The resulting products from each 5-mer are mixed and sequenced on the Illumina Genome Analyzer platform. Following sequencing and initial processing, tags representing the 3′ flanks of human-specific L1 insertions are aligned to the human reference genome (hg18).
Figure 2.
Figure 2.
Validation of peaks resulting from the clustering of alignments. A typical sequence peak is indicated in A. The genome is represented as the colored band spanning the bottom of the figure, and the bases are represented as colored squares (T, red; A, yellow; G, blue; C, green). Stacks of reads are represented on top of the genome as aligned, with a maximum of five unique reads per alignment shown. Evidence for the presence of a polyadenylated sequence absent from the reference genome is indicated by the red outline, which corresponds to the 3′ polyA sequence associated with L1 insertions. The step-like appearance of the sequence peak is due to multiple binding sites for degenerate primers. (B) Genotyping PCR scheme used for the validation of insertions indicated by sequencing peaks. Primers FP and EP flank the expected insertion, indicated by the schematic L1 of unknown length. PCR using these two primers yields an empty site band E of a predetermined size in the cases where the L1 is heterozygous (+/−) for presence or absent entirely (false-positive, −/−). PCR using the AC-specific primer in the L1 3′ UTR (L1P) along with the FP primer yields a band corresponding to the presence of an L1 insertion F. Presence of the filled site, F, and empty site, E, indicates a heterozygous insertion, while presence of only the filled site band indicates homozygous insertion at the specific site. Bands shown on the gel are for three different sites.
Figure 3.
Figure 3.
L1Hs insertions found in various human genomes. L1Hs insertions found for each individual are categorized based on whether or not they are in the reference genome. Reference insertions are subcategorized into pre-Ta, Ta-0, and Ta-1 based on the presence of diagnostic nucleotides. Uncategorized Ta elements (green) are missing one or both characters necessary for placement into either group, often because the nucleotides are not present due to 3′ truncation of the elements. Bars marked with an asterisk (*) indicate samples that did not yield the expected number of insertions, likely due to poor genomic DNA quality or errors in sample preparation.
Figure 4.
Figure 4.
Genomic distribution of reference and nonreference L1 insertions. Reference L1 insertions are shown below the genome; nonreference L1 insertions are shown above the genome. The width of each vertical bar corresponds to a 10-Mb window of a chromosome, represented by the alternating dark and light regions as indicated. The heights of the bins are normalized to be comparable across reference and nonreference bins.
Figure 5.
Figure 5.
LINE-1 profiles recapitulate genetic ancestry. (A) Depiction of an L1 profile. Each row of squares corresponds to a different individual, and each column corresponds to an L1 insertion that exists in one or more individuals analyzed. A black square indicates the presence of an insertion at the corresponding site in the corresponding individual's genome. (B) Dendrogram representing the maximum parsimony relationship between 19 individuals (three pairs of Mz twins are excluded). Family trios are as follows: SB4Mo/Fa/Ch, SB3Mo/Fa/Ch, GM12891/92/78, JapnIMo/Fa/Ch, JapnYMo/Fa/Ch, GM19238/39/40. These individuals are members of Caucasian, Japanese, and Yoruba ethnic groups as indicated. Individuals prefixed with “GM” are from the Utah CEPH population.
Figure 6.
Figure 6.
Insertions shared between various numbers of individuals. Histograms for reference (A), nonreference (B), and combined reference and nonreference (C) L1 insertions are shown. The height of each bar represents the number of reference or nonreference insertions shared between the corresponding number of unrelated individuals (genomes). The y-axis (number of shared insertions) is scaled differently for reference and nonreference insertions.
Figure 7.
Figure 7.
Estimation of the number of L1Hs elements in humans. The various estimates discussed are plotted as log number of individuals versus number of L1Hs insertions predicted by the given model. The logistic regression model is plotted as gray circles, and the estimate based on segregating sites is plotted as gray triangles. The dotted lines indicate the upper (open diamonds) and lower (open squares) bounds for the estimate based on segregating sites calculated as described.

Comment in

  • Jumping genes.
    de Souza N. de Souza N. Nat Methods. 2010 Aug;7(8):579. doi: 10.1038/nmeth0810-579. Nat Methods. 2010. PMID: 20704015 No abstract available.

Similar articles

Cited by

References

    1. Akagi K, Li J, Stephens RM, Volfovsky N, Symer DE 2008. Extensive variation between inbred mouse strains due to endogenous L1 retrotransposition. Genome Res 18: 869–880 - PMC - PubMed
    1. Ahn SM, Kim TH, Lee S, Kim D, Ghang H, Kim DS, Kim BC, Kim SY, Kim WY, Kim C 2009. The first Korean genome sequence and analysis: Full genome sequencing for a socio-ethnic group. Genome Res 19: 1622–1629 - PMC - PubMed
    1. Badge RM, Alisch RS, Moran JV 2003. ATLAS: A system to selectively identify human-specific L1 insertions. Am J Hum Genet 72: 823–838 - PMC - PubMed
    1. Bamshad MJ, Wooding S, Watkins WS, Ostler CT, Batzer MA, Jorde LB 2003. Human population genetic structure and inference of group membership. Am J Hum Genet 72: 578–589 - PMC - PubMed
    1. Barbujani G, Magagni A, Minch E, Cavalli-Sforza LL 1997. An apportionment of human DNA diversity. Proc Natl Acad Sci 94: 4516–4519 - PMC - PubMed

Publication types