. 2010 Aug;21(8):1275-80.
doi: 10.1681/ASN.2009121224. Epub 2010 May 20.

Activator of G protein signaling 3 promotes epithelial cell proliferation in PKD

Affiliations

Activator of G protein signaling 3 promotes epithelial cell proliferation in PKD

Rama Nadella et al. J Am Soc Nephrol. 2010 Aug.

Abstract

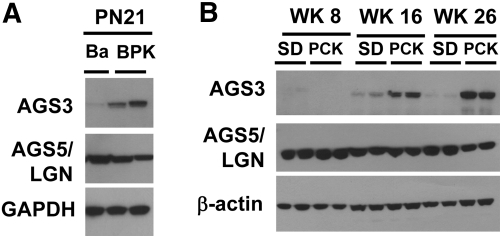
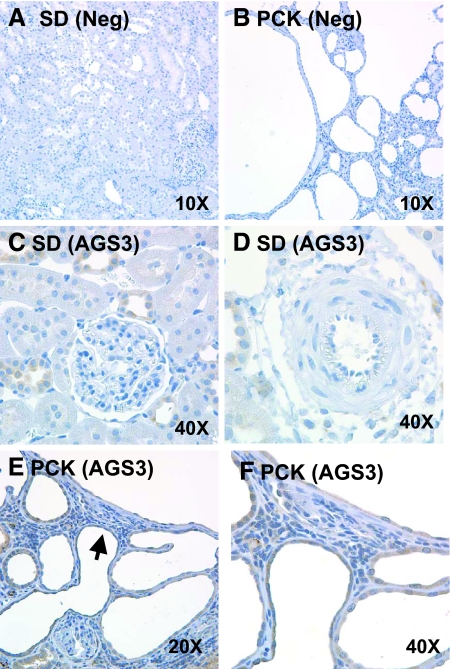
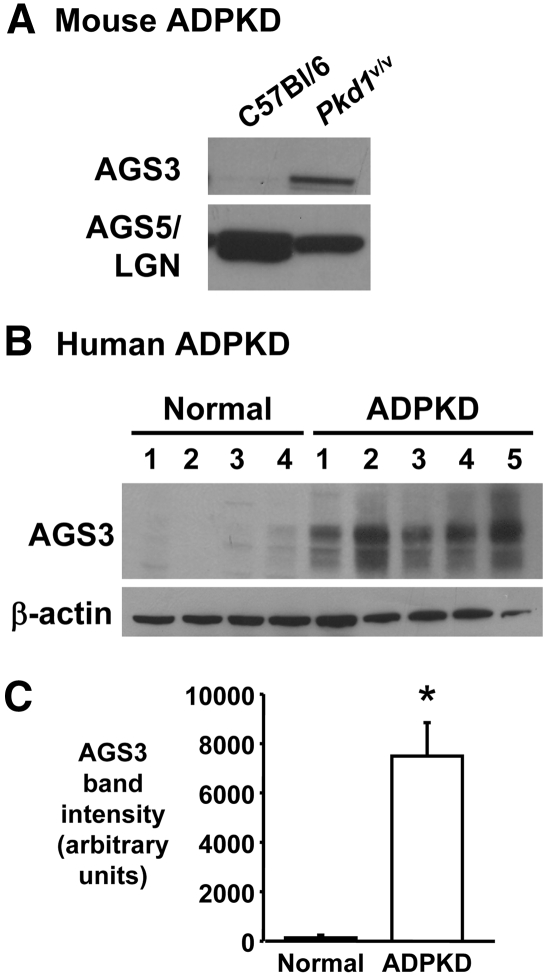
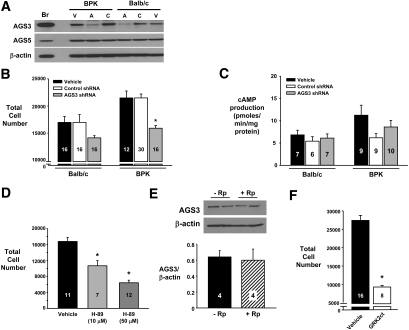
The activation of heterotrimeric G protein signaling is a key feature in the pathophysiology of polycystic kidney diseases (PKD). In this study, we report abnormal overexpression of activator of G protein signaling 3 (AGS3), a receptor-independent regulator of heterotrimeric G proteins, in rodents and humans with both autosomal recessive and autosomal dominant PKD. Increased AGS3 expression correlated with kidney size, which is an index of severity of cystic kidney disease. AGS3 expression localized exclusively to distal tubular segments in both normal and cystic kidneys. Short hairpin RNA-induced knockdown of endogenous AGS3 protein significantly reduced proliferation of cystic renal epithelial cells by 26 +/- 2% (P < 0.001) compared with vehicle-treated and control short hairpin RNA-expressing epithelial cells. In summary, this study suggests a relationship between aberrantly increased AGS3 expression in renal tubular epithelia affected by PKD and epithelial cell proliferation. AGS3 may play a receptor-independent role to regulate Galpha subunit function and control epithelial cell function in PKD.


Figures

Figure 1.
Figure 1.
Increased expression of AGS3 protein in the kidneys from murine models of ARPKD. (A and B) Representative immunoblot analysis for AGS3 and AGS5/LGN expression in mouse (A) and rat kidneys (B). (A) Ba and BPK rat kidney lysates (n = 3 to 4 kidneys per group) at postnatal day 21 (PN21) are examined. (B) SD and PCK rat kidney lysates (n = 4 to 6 rat samples per time point and group) at postnatal weeks 8 (WK8), 16 (WK16), and 26 (WK26) are examined. From these findings, the PCK rat kidneys exhibit a temporal increase in the AGS3 protein between weeks 8 and 26. No change in the expression of AGS5/LGN is determined. Glyceraldehyde-3-phosphate dehydrogenase (GAPDH; A) or β-actin (B) is used to ensure equal loading of the protein samples.
Figure 2.
Figure 2.
Immunolocalization of AGS3 in ARPKD rat kidneys. AGS3 localization is performed in the kidneys of SD (A, C, and D) and PCK (B, E, and F) rats. Affinity-purified AGS3 antibody (pep32) is incubated at a 1:250 dilution on kidney sections from SD (C and D) and PCK (E and F) rats. As a negative control, SD (A) and PCK (B) rat kidneys are incubated with the primary AGS3 antibody in the presence of the competing AGS3 peptide conjugate or normal rodent serum (data not shown). The brown diaminobenzidine staining demonstrates the specific localization of the AGS3 protein within distinct cell types in the kidney. Sections are counterstained with hematoxylin. Arrowhead in E signifies the magnified view of the area in F. n = 4 kidneys per group.
Figure 3.
Figure 3.
Increased renal AGS3 expression in a mouse model and humans with ADPKD. (A and B) Representative immunoblot analysis is performed in kidneys obtained from Pkd1v/v hypomorphic mouse (A) and humans with ADPKD kidneys (B). (A) Normal C57Bl/6 and cystic Pkd1v/v hypomorph kidneys are harvested at postnatal day 14 and analyzed for AGS3 and AGS5/LGN protein expression. The Pkd1v/v mouse model of ADPKD exhibits a point mutation in the Pkd1 gene, resulting in inefficient cleavage of polycystin 1 (PC1), which is necessary for optimal activity of PC1. (B) Normal human kidneys (n = 4) and human ADPKD kidneys (n = 5) are analyzed for the expression of AGS3. (C) Densitometry of the human AGS3 bands are analyzed (P < 0.001). β-actin is used to determine equal loading of the lanes.
Figure 4.
Figure 4.
AGS3 promotes increased epithelial cell number in a Gβγ-dependent pathway. Ba and BPK epithelial cells are transduced at a multiplicity of infection of 40 with lentiviral vectors expressing shRNA (control or specifically targeted to AGS3) or GRK2ct cDNA. (A through C) For the AGS3 knockdown experiments, the two most effective AGS3 shRNAs (see Supplemental Figure 4) are used for the Western blot (A), cell proliferation assay (B), and cAMP assay (C). (A) Western blot analysis demonstrates a specific reduction in AGS3 expression after combined AGS3 shRNA knockdown (A) compared with control shRNA (C) or vehicle-treated cells (V). No off-target knockdown of AGS5/LGN or β-actin is detected using the AGS3 shRNA. Br, brain (positive control); V, vehicle; A, AGS3 shRNA; C, control (scrambled) shRNA. (B) The genetically modified Ba and BPK cells are aliquotted into 96-well plates and examined for cell number 24 hours later by CyQuant fluorescence assay. *P < 0.001, significant difference between vehicle-treated cells. (C) cAMP levels are examined by ELISA using cell lysates obtained from the genetically modified Ba and BPK cells treated with vehicle or transduced with lentiviral vectors expressing control or specific AGS3 shRNA (n = 6 to 10 samples per group). (D) BPK epithelial cells are incubated with H-89 (10 and 50 μM) for 24 hours before determination of cell numbers by CyQuant fluorescence assay. (E) BPK epithelial cells are incubated with or without Rp-adenosine-3′,5′-monophosphorothioate (20 μM), a specific PKA inhibitor, for 5 hours. Cells are collected for protein isolation to determine the expression of AGS3 by Western blot analysis. Densitometry is performed to determine the band intensities. (F) BPK epithelial cells genetically modified to overexpress GRK2ct are aliquotted into a 96-well plate; 24 hours later, the cell proliferation is measured using the CyQuant fluorescence assay and compared with vehicle-treated BPK cells. *P < 0.001, significant difference between vehicle-treated cells. Numbers of samples in each group are shown in each graph.

Similar articles

Cited by

References

    1. Grantham JJ: Polycystic kidney disease: From the bedside to the gene and back. Curr Opin Nephrol Hypertens 10: 533–542, 2001 - PubMed
    1. Delmas P, Nomura H, Li X, Lakkis M, Luo Y, Segal Y, Fernandez-Fernandez JM, Harris P, Frischauf AM, Brown DA, Zhou J: Constitutive activation of G-proteins by polycystin-1 is antagonized by polycystin-2. J Biol Chem 277: 11276–11283, 2002 - PubMed
    1. Parnell SC, Magenheimer BS, Maser RL, Rankin CA, Smine A, Okamoto T, Calvet JP: The polycystic kidney disease-1 protein, polycystin-1, binds and activates heterotrimeric G-proteins in vitro. Biochem Biophys Res Commun 251: 625–631, 1998 - PubMed
    1. Parnell SC, Magenheimer BS, Maser RL, Zien CA, Frischauf AM, Calvet JP: Polycystin-1 activation of c-Jun N-terminal kinase and AP-1 is mediated by heterotrimeric G proteins. J Biol Chem 277: 19566–19572, 2002 - PubMed
    1. Cismowski MJ, Takesono A, Ma C, Lizano JS, Xie X, Fuernkranz H, Lanier SM, Duzic E: Genetic screens in yeast to identify mammalian nonreceptor modulators of G-protein signaling. Nat Biotechnol 17: 878–883, 1999 - PubMed

Publication types

LinkOut - more resources