. 2010 Jul;177(1):208-18.
doi: 10.2353/ajpath.2010.090952. Epub 2010 May 20.

Epithelial to mesenchymal transition in gingival overgrowth

Affiliations

Epithelial to mesenchymal transition in gingival overgrowth

Siddika Selva Sume et al. Am J Pathol. 2010 Jul.

Abstract

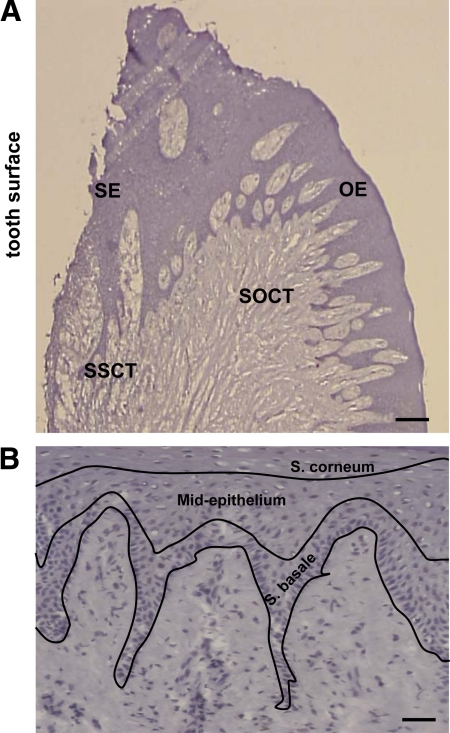
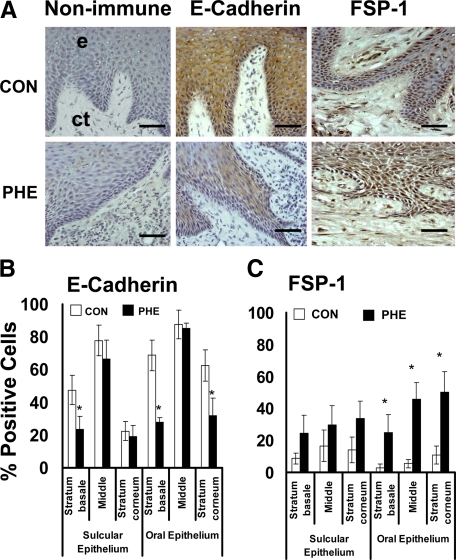
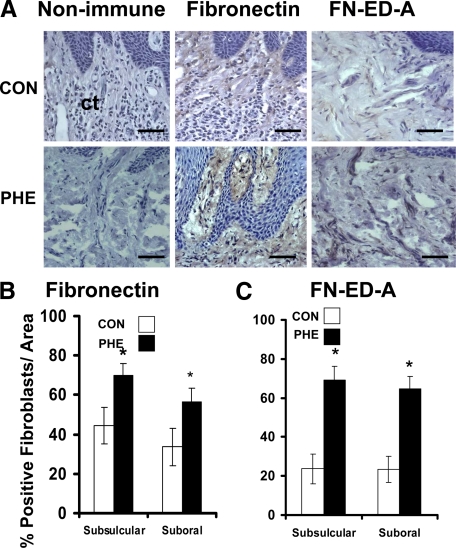
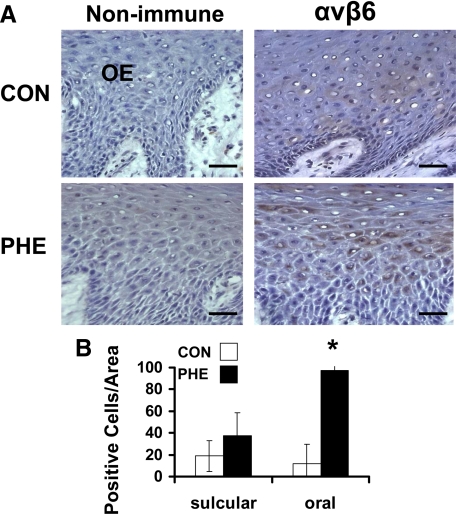
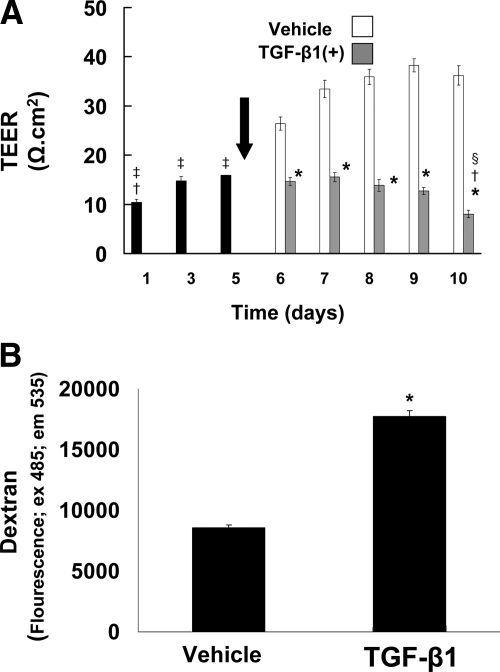
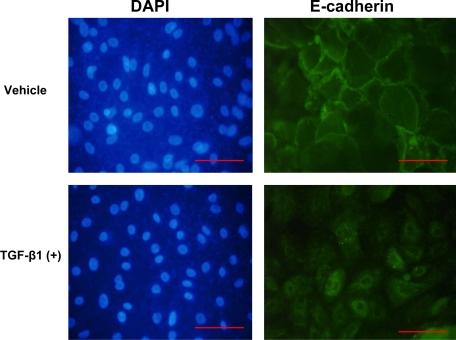
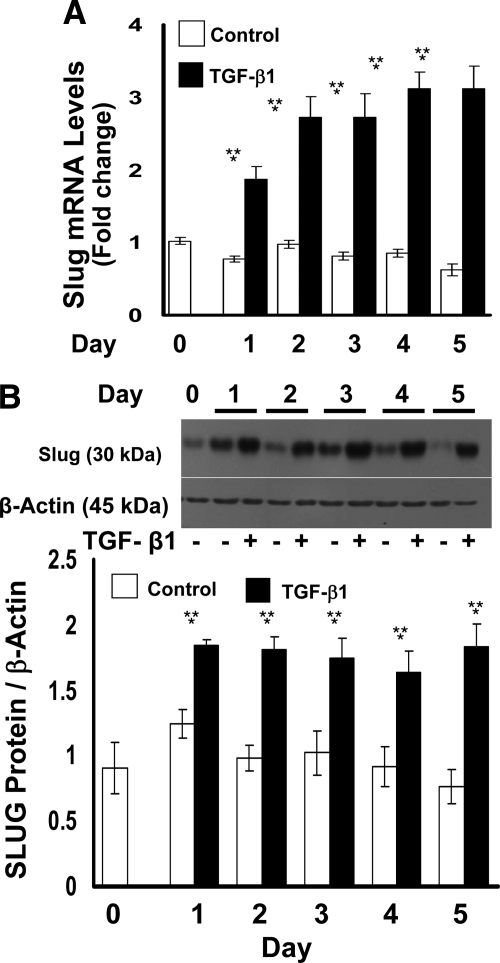
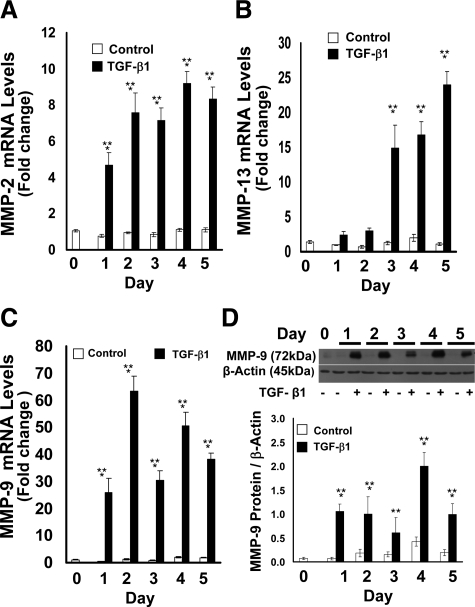
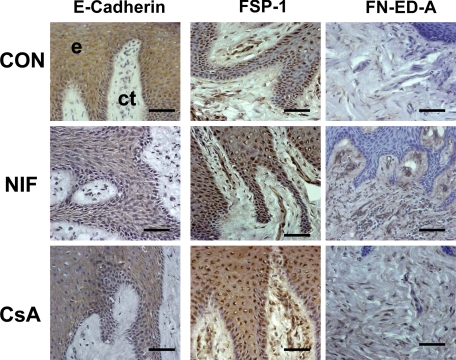
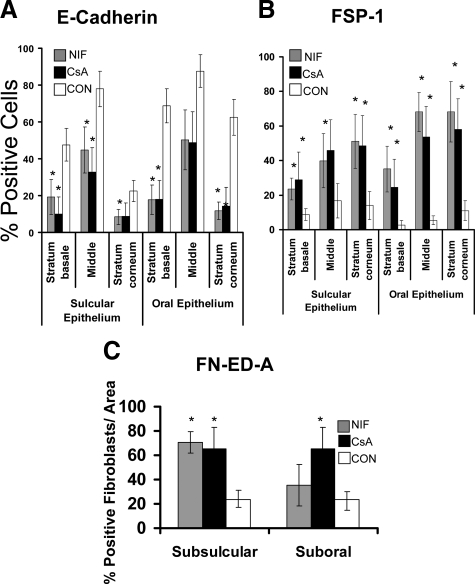
Epithelial to mesenchymal transition (EMT) occurs normally in development. In pathology, EMT drives cancer and fibrosis. Medication with phenytoin, nifedipine, and cyclosporine-A often causes gingival overgrowth. Based partly on the histopathology of gingival overgrowth, the present study investigates the hypothesis that EMT could contribute to its development. We found that phenytoin-induced human gingival overgrowth tissues, the most fibrotic drug-induced variety, contain diminished epithelial E-cadherin expression, whereas fibroblast-specific protein-1 (FSP-1) and alphavbeta6 integrin levels are up-regulated. In connective tissue stroma, fibronectin and alternatively spliced fibronectin extra type III domain A (FN-ED-A) levels are increased in overgrowth lesions. Transforming growth factor (TGF)-beta1 treatment of primary human gingival epithelial cells cultured in transwell plates resulted in inhibited barrier function as determined by reduced electrical resistance, paracellular permeability assays, and cell surface E-cadherin expression. Moreover, TGF-beta1 altered the expression of other markers of EMT determined at the mRNA and protein levels: E-cadherin decreased, whereas SLUG, fibronectin, matrix metalloproteinase (MMP)2, MMP9, and MMP13 increased. Nifedipine- and cyclosporine A-induced gingival overgrowth tissues similarly contain diminished E-cadherin and elevated levels of FSP-1 and fibronectin, but normal levels of alphavbeta6 integrin. In summary, data in vitro support that human gingival epithelial cells undergo functional and gene expression changes consistent with EMT in response to TGF-beta1, and in vivo studies show that important EMT markers occur in clinical gingival overgrowth tissues. These findings support the hypothesis that EMT likely occurs in drug-induced gingival overgrowth.


Figures

Figure 1
Figure 1
Sites in human gingival tissues evaluated for immunohistochemistry staining. A: SE, sulcular epithelium; OE, oral epithelium; SSCT, subsulcular connective tissue; SOCT, suboral connective tissue; Scale bar = 0.14 mm, at ×25 magnification. B: Regions of epithelium; Scale bar = 50 μm, at magnification ×200 magnification.
Figure 2
Figure 2
E-cadherin and FSP-1 expression in phenytoin-induced gingival overgrowth and no overgrowth control tissues. A: Representative sections from oral epithelium (e) and suboral connective tissue (ct) of immunohistochemistry staining of phenytoin induced gingival overgrowth (PHE) and no overgrowth control (CON) tissues; Scale bar = 35 μm, at ×400 magnification. B: Histomorphometric and quantitative analyses of E-cadherin immunostaining in phenytoin induced gingival overgrowth (PHE) in different areas of gingival epithelium (0.09 mm2) compared with no overgrowth control tissues (CON). C: Histomorphometric and quantitative analyses of FSP-1 immunostaining in phenytoin induced gingival overgrowth tissues (PHE) in different areas of gingival epithelium compared with no overgrowth control (CON) tissues; n = 11 in control, n = 7 in phenytoin. Data are means ± SE; *P < 0.05 compared with control by analysis of variance with Bonferroni correction for multiple tests.
Figure 3
Figure 3
Fibronectin and fibronectin FN-ED-A expression in phenytoin-induced gingival overgrowth and no overgrowth control tissues. A: Representative immunohistochemistry-stained sections from suboral connective tissue (ct) of phenytoin-induced gingival overgrowth (PHE) and control (CON) tissues. Scale bar = 35 μm at ×400 magnification. B: Histomorphometric and quantitative analyses of fibronectin immunostaining in phenytoin-induced gingival overgrowth (PHE) in subsulcular and suboral connective tissues compared with no overgrowth control (CON) tissues. C: Histomorphometric and quantitative analyses of FN-ED-A immunostaining in phenytoin (PHE)-induced gingival overgrowth in subsulcular and suboral connective tissues compared with control (CON) tissues. For fibronectin analyses: n = 9 in no overgrowth control; n = 5 for phenytoin overgrowth. For FN-ED-A analyses: n = 6 for no overgrowth control; n = 5, phenytoin. Data are means ± SE; *P < 0.05 compared with control by analysis of variance with Bonferroni correction for multiple tests.
Figure 4
Figure 4
αvβ6 Integrin expression in phenytoin-induced gingival overgrowth and no overgrowth control tissues. A: Representative immunohistochemistry sections from oral epithelium (OE) of phenytoin (PHE)-induced gingival overgrowth and control (CON) tissues. Scale bar = 35 μm at ×400 magnification. B: Histomorphometric and quantitative analyses of αvβ6 integrin immunostaining in phenytoin-induced gingival overgrowth (PHE) in sulcular and oral epithelium compared with no overgrowth control (CON) tissues (0.09 mm2). Data are means ± SE; n = 5 for both control and phenytoin groups; *P < 0.05 compared with control by analysis of variance with Bonferroni correction for multiple tests.
Figure 5
Figure 5
TGF-β1 disrupts cell layer integrity and paracellular permeability in primary cultured human gingival epithelial cells. A: Cells were cultured on Transwell membranes. TEER was monitored for 10 days. After reaching stable resistance on day five, TGF-β1 (5 ng/ml) or vehicle treatment was begun (arrow). TEER was recorded every day for five days after the start of treatment. Values are means ± SE of triplicate determinations; *P < 0.001 compared with vehicle treatment; P < 0.001 compared with day three and day five; P < 0.001 compared with vehicle treatment day six through day ten; §P < 0.05 compared with TGF-β1 treatment day six and day seven by analysis of variance with Bonferroni correction for multiple tests. B: Cells cultured on Transwell membranes were treated with TGF-β1 (5 ng/ml) or vehicle for five days. On day five, FITC-labeled dextran was added to the cells for one hour as described in Materials and Methods. Values are means ± SE of triplicate determinations; *P < 0.001 compared with vehicle treatment by analysis of variance.
Figure 6
Figure 6
TGF-β1 inhibits cell surface E-cadherin expression in primary cultured human gingival epithelial cells. Gingival epithelial cells from a healthy donor were cultured until 80% confluent followed by treatment with TGF-β1 (5 ng/ml) or vehicle for five days. Cells were stained for E-cadherin and FITC-labeled secondary antibody for immunofluorescence on day five (right) and with DAPI to stain nuclei (left). The same fields are shown for each chromophore. Data show representative images from multiple stainings of cells at ×400 magnification; Scale bar = 0.02 mm.
Figure 7
Figure 7
TGF-β1 regulation of E-cadherin and fibronectin protein (A and C) and mRNA (B and D) expression in primary cultured human gingival epithelial cells. E-cadherin (A) and fibronectin (C) Western blots of cell layer extracts of primary human gingival epithelial cells. Cells were cultured and treated with TGF-β1 or no treatment control for five days. β-actin antibody was for normalization as described in Materials and Methods. Blots are representative results obtained from cells from three different subjects with consistent results. Quantitative data were obtained by pooling data obtained from three different subjects (n = 3). Fibronectin protein was not detected in control cultures. Real-time PCR analyses of E-cadherin and fibronectin expression of primary human gingival epithelial cells for E-cadherin (B) and fibronectin (D). Cells were cultured and treated with or without TGF-β1 for five days. Total cellular RNA was extracted on each day, and real-time qPCR was conducted using GAPDH as control. Data are represented as fold changes compared with untreated cells on day one. Data are means ± SE from triplicate real-time PCR assays each of cells isolated from three different subjects (n = 3; *P < 0.05; **P < 0.001, Student t test, compared with no treatment control cultures).
Figure 8
Figure 8
TGF-β1 regulation of SLUG mRNA (A) and protein (B) expression in primary cultured human gingival epithelial cells. Cells were cultured and treated with or without TGF-β1 for five days. A: Total cellular RNA was extracted on each day and real-time qPCR was conducted using GAPDH as control. Data are represented as fold change compared with untreated control cultures. Data are from triplicate real-time PCR assays of all samples. **P < 0.001 compared with day 0; *P < 0.001 compared with no treatment control. B: Western blots of cell layer extracts for SLUG of primary human gingival epithelial cells. β-actin antibody was used to verify equal loading of gels. The Western blot shown is representative of three experiments with consistent results. Quantitative data are from experiments performed in triplicate each with cells from three different subjects. Data shown are means ± SE; *P < 0.05 compared with no treatment controls; #P < 0.05 compared with day 0 by analysis of variance with Bonferroni correction for multiple tests.
Figure 9
Figure 9
TGF-β1 regulation of MMP-2, MMP-13, and MMP-9 mRNA (AC) and MMP-9 protein (D) expression in primary cultured human gingival epithelial cells. Real-time PCR analyses of (A) MMP-2, (B) MMP-13, and (C) MMP-9 expression of primary human gingival epithelial cells. Cells were cultured and treated with or without TGF-β1 for 5 days. Total RNA was extracted on each day for real-time qPCR. Data are fold changes compared with untreated cells normalized to GAPDH levels and are from triplicate real-time qPCR assays of samples derived from three subjects, all with similar outcomes. D: MMP-9 Western blots of cell layer extracts of primary human gingival epithelial cells. Cells were cultured and treated as described in the Materials and Methods section with TGF-β1 or no treatment control for five days. β-actin antibody was used to verify equal loading of gels. The blot is from one representative experiment done with cells derived from three different subjects (n = 3); quantitative data are pooled (n = 3); and data are means ± SE; **P < 0.001 compared with control day 0; *P < 0.001 compared with no treatment control by analysis of variance with Bonferroni correction for multiple tests.
Figure 10
Figure 10
E-cadherin, FSP-1, and Fibronectin ED-A expression in cyclosporine A–, nifedipine-induced gingival overgrowth, and control tissues. Representative sections from oral epithelium (e) and suboral connective tissue (ct) for the immunohistochemical staining of E-cadherin, FSP-1, and FN-ED-A expression in nifedipine (NIF), cyclosporin A (CSA), and control (CON) tissues. Each bar represents 35 μm at a magnification of ×400.
Figure 11
Figure 11
Histomorphometric and quantitative analyses in nifedipine and cyclosporine A human gingival overgrowth tissues. A: E-cadherin immunostaining in nifedipine- (NIF) and cyclosporin A– (CSA) induced gingival overgrowth compared with control (CON) in different areas of gingival epithelium (0.09 mm2); n = 7 for nifedipine and cyclosporin A; n = 11 for control. B: Histomorphometric and quantitative analyses of FSP-1 immunostaining in nifedipine- (NIF) and cyclosporin A– (CSA) induced gingival overgrowth tissues compared with control (CON) in different areas of gingival epithelium n = 6 for cyclosporin A; n = 5 for nifedipine; and n = 11 for control. C: Histomorphometric and quantitative analyses of FN-ED-A immunostaining in nifedipine- (NIF) and cyclosporin A– (CSA) induced gingival overgrowth compared with control (CON) in subsulcular and suboral connective tissues; n = 5 for cyclosporin A; n = 5 for nifedipine; and n = 6 for control. Data are means ± SE. Each bar represents 25 μm at a magnification of ×400. *P < 0.05 compared with control by analysis of variance with Bonferroni correction for multiple tests.

References

    1. Kalluri R, Neilson EG. Epithelial-mesenchymal transition and its implications for fibrosis. J Clin Invest. 2003;112:1776–1784. - PMC - PubMed
    1. Uzel MI, Kantarci A, Hong HH, Uygur C, Sheff MC, Firatli E, Trackman PC. Connective tissue growth factor in drug-induced gingival overgrowth. J Periodontol. 2001;72:921–931. - PubMed
    1. Black SA, Jr, Palamakumbura AH, Stan M, Trackman PC. Tissue-specific mechanisms for CCN2/CTGF persistence in fibrotic gingiva: interactions between cAMP and MAPK signaling pathways, and prostaglandin E2-EP3 receptor mediated activation of the c-JUN N-terminal kinase. J Biol Chem. 2007;282:15416–15429. - PMC - PubMed
    1. Black SA, Jr, Trackman PC. Transforming growth factor-β1 (TGFβ1) stimulates connective tissue growth factor (CCN2/CTGF) expression in human gingival fibroblasts through a RhoA-independent. Rac1/Cdc42-dependent mechanism: statins with forskolin block TGFβ1-induced CCN2/CTGF expression. J Biol Chem. 2008;283:10835–10847. - PMC - PubMed
    1. Trackman PC, Kantarci A. Connective tissue metabolism and gingival overgrowth. Crit Rev Oral Biol Med. 2004;15:165–175. - PubMed

Publication types

MeSH terms