

Visualizing enveloping layer glycans during zebrafish early embryogenesis
- PMID: 20489181
- PMCID: PMC2890823
- DOI: 10.1073/pnas.0912081107
Visualizing enveloping layer glycans during zebrafish early embryogenesis
Abstract
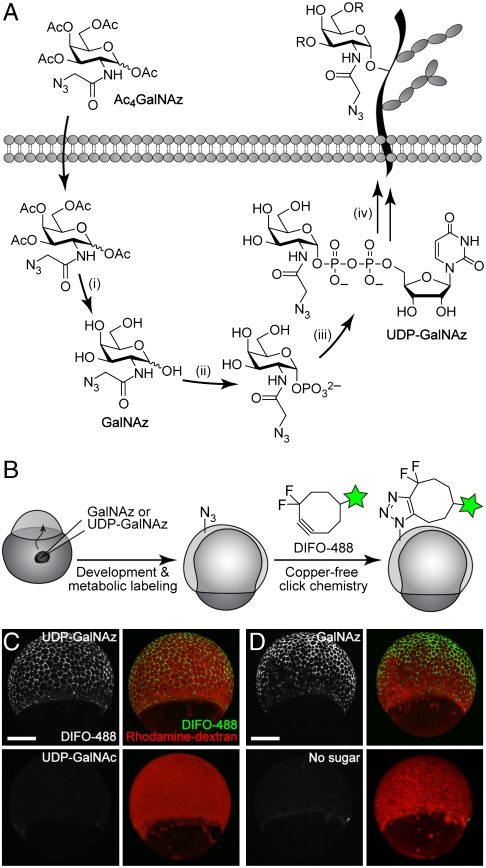
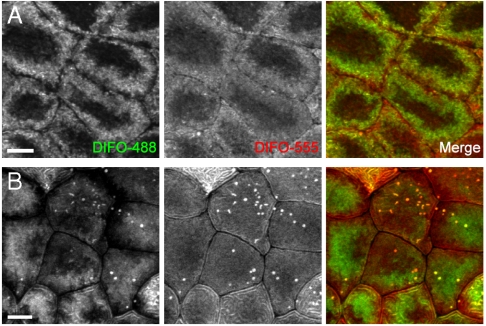
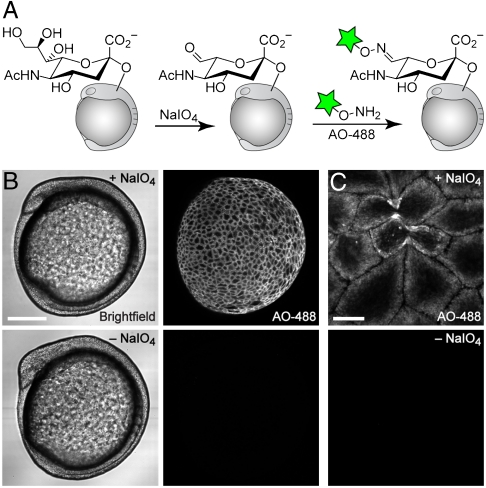
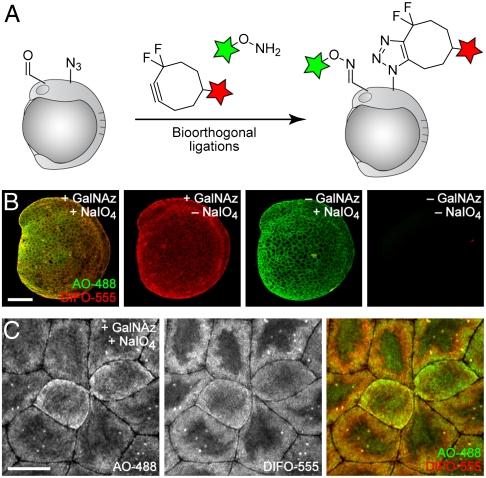
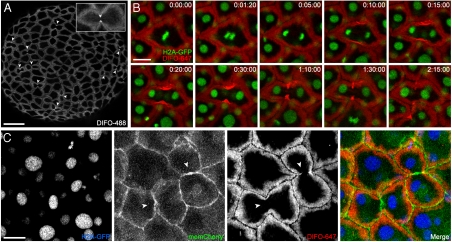
Developmental events can be monitored at the cellular and molecular levels by using noninvasive imaging techniques. Among the biomolecules that might be targeted for imaging analysis, glycans occupy a privileged position by virtue of their primary location on the cell surface. We previously described a chemical method to image glycans during zebrafish larval development; however, we were unable to detect glycans during the first 24 hours of embryogenesis, a very dynamic period in development. Here we report an approach to the imaging of glycans that enables their visualization in the enveloping layer during the early stages of zebrafish embryogenesis. We microinjected embryos with azidosugars at the one-cell stage, allowed the zebrafish to develop, and detected the metabolically labeled glycans with copper-free click chemistry. Mucin-type O-glycans could be imaged as early as 7 hours postfertilization, during the gastrula stage of development. Additionally, we used a nonmetabolic approach to label sialylated glycans with an independent chemistry, enabling the simultaneous imaging of these two distinct classes of glycans. Imaging analysis of glycan trafficking revealed dramatic reorganization of glycans on the second time scale, including rapid migration to the cleavage furrow of mitotic cells. These studies yield insight into the biosynthesis and dynamics of glycans in the enveloping layer during embryogenesis and provide a platform for imaging other biomolecular targets by microinjection of appropriately functionalized biosynthetic precursors.
Conflict of interest statement
The authors declare no conflict of interest.
Figures
Similar articles
-
Biocompatible copper(I) catalysts for in vivo imaging of glycans.J Am Chem Soc. 2010 Dec 1;132(47):16893-9. doi: 10.1021/ja106553e. Epub 2010 Nov 9. J Am Chem Soc. 2010. PMID: 21062072 Free PMC article.
-
Metabolic labeling of fucosylated glycans in developing zebrafish.ACS Chem Biol. 2011 Jun 17;6(6):547-52. doi: 10.1021/cb100284d. Epub 2011 Apr 5. ACS Chem Biol. 2011. PMID: 21425872 Free PMC article.
-
Imaging glycans in zebrafish embryos by metabolic labeling and bioorthogonal click chemistry.J Vis Exp. 2011 Jun 6;(52):2686. doi: 10.3791/2686. J Vis Exp. 2011. PMID: 21673647 Free PMC article.
-
Direct Visualization of Live Zebrafish Glycans via Single-Step Metabolic Labeling with Fluorophore-Tagged Nucleotide Sugars.Angew Chem Int Ed Engl. 2019 Oct 1;58(40):14327-14333. doi: 10.1002/anie.201907410. Epub 2019 Aug 28. Angew Chem Int Ed Engl. 2019. PMID: 31295389 Free PMC article. Review.
-
"Casting" light on the role of glycosylation during embryonic development: insights from zebrafish.Glycoconj J. 2013 Jan;30(1):33-40. doi: 10.1007/s10719-012-9390-5. Epub 2012 May 26. Glycoconj J. 2013. PMID: 22638861 Free PMC article. Review.
Cited by
-
A BODIPY-cyclooctyne for protein imaging in live cells.Chembiochem. 2011 Sep 19;12(14):2137-9. doi: 10.1002/cbic.201100277. Epub 2011 Aug 9. Chembiochem. 2011. PMID: 21830285 Free PMC article. No abstract available.
-
Cracking the "Sugar Code": A Snapshot of N- and O-Glycosylation Pathways and Functions in Plants Cells.Front Plant Sci. 2021 Feb 19;12:640919. doi: 10.3389/fpls.2021.640919. eCollection 2021. Front Plant Sci. 2021. PMID: 33679857 Free PMC article. Review.
-
Visualizing specific protein glycoforms by transmembrane fluorescence resonance energy transfer.Nat Commun. 2012 Jun 19;3:907. doi: 10.1038/ncomms1906. Nat Commun. 2012. PMID: 22713749
-
Achieving Controlled Biomolecule-Biomaterial Conjugation.Chem Rev. 2018 Aug 22;118(16):7702-7743. doi: 10.1021/acs.chemrev.8b00253. Epub 2018 Jul 24. Chem Rev. 2018. PMID: 30040387 Free PMC article. Review.
-
The Emerging Role of the Mammalian Glycocalyx in Functional Membrane Organization and Immune System Regulation.Front Cell Dev Biol. 2020 Apr 15;8:253. doi: 10.3389/fcell.2020.00253. eCollection 2020. Front Cell Dev Biol. 2020. PMID: 32351961 Free PMC article. Review.
References
-
- Gilbert SF, Singer SR, Tyler MS, Kozlowski RN. Developmental Biology. Sunderland, Mass: Sinauer Associates; 2006.
-
- Yaniv K, et al. Live imaging of lymphatic development in the zebrafish. Nat Med. 2006;12:711–716. - PubMed
-
- Keller PJ, Schmidt AD, Wittbrodt J, Stelzer EH. Reconstruction of zebrafish early embryonic development by scanned light sheet microscopy. Science. 2008;322:1065–1069. - PubMed
-
- Giepmans BNG, Adams SR, Ellisman MH, Tsien RY. The fluorescent toolbox for assessing protein location and function. Science. 2006;312:217–224. - PubMed
Publication types
MeSH terms
Substances
Grants and funding
LinkOut - more resources
Full Text Sources
Other Literature Sources
Molecular Biology Databases
