. 2010 Jul 16;285(29):22027-35.
doi: 10.1074/jbc.M110.126870. Epub 2010 May 20.

Decrease in membrane phospholipid unsaturation induces unfolded protein response

Affiliations

Decrease in membrane phospholipid unsaturation induces unfolded protein response

Hiroyuki Ariyama et al. J Biol Chem. .

Abstract

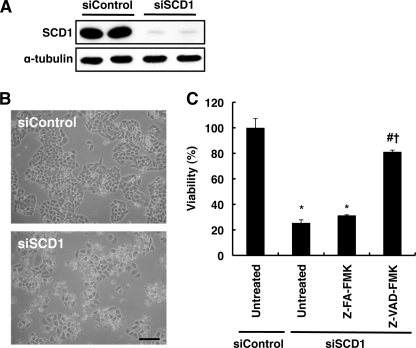
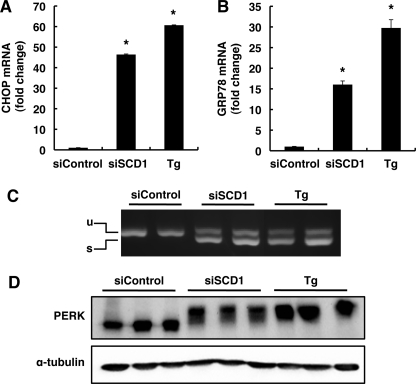
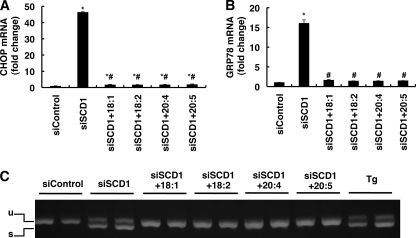
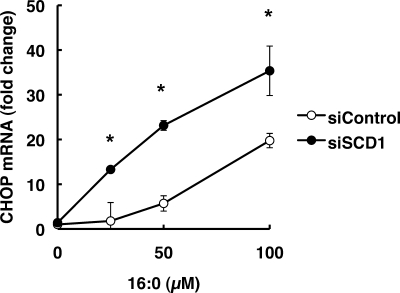
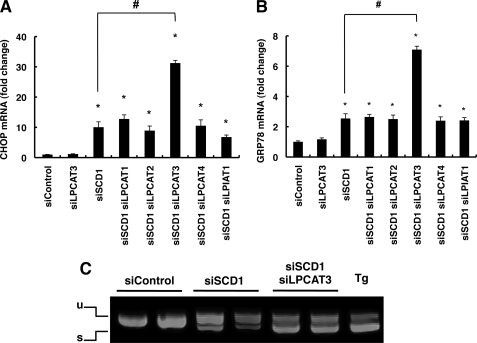
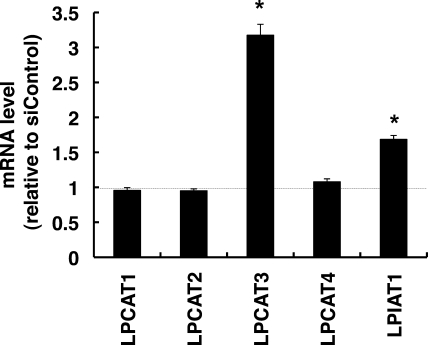
Various kinds of fatty acids are distributed in membrane phospholipids in mammalian cells and tissues. The degree of fatty acid unsaturation in membrane phospholipids affects many membrane-associated functions and can be influenced by diet and by altered activities of lipid-metabolizing enzymes such as fatty acid desaturases. However, little is known about how mammalian cells respond to changes in phospholipid fatty acid composition. In this study we showed that stearoyl-CoA desaturase 1 (SCD1) knockdown increased the amount of saturated fatty acids and decreased that of monounsaturated fatty acids in phospholipids without affecting the amount or the composition of free fatty acid and induced unfolded protein response (UPR), evidenced by increased expression of C/EBP homologous protein (CHOP) and glucose-regulated protein 78 (GRP78) mRNAs and splicing of Xbox-binding protein 1 (XBP1) mRNA. SCD1 knockdown-induced UPR was rescued by various unsaturated fatty acids and was enhanced by saturated fatty acid. Lysophosphatidylcholine acyltransferase 3 (LPCAT3), which incorporates preferentially polyunsaturated fatty acids into phosphatidylcholine, was up-regulated in SCD1 knockdown cells. Knockdown of LPCAT3 synergistically enhanced UPR with SCD1 knockdown. Finally we showed that palmitic acid-induced UPR was significantly enhanced by LPCAT3 knockdown as well as SCD1 knockdown. These results suggest that a decrease in membrane phospholipid unsaturation induces UPR.


Figures

FIGURE 1.
FIGURE 1.
SCD1 knockdown induces cell death in HeLa cells. A, a control siRNA (siControl) and SCD1 siRNA (siSCD1) were transfected into HeLa cells. After 48 h cell lysates were prepared and subjected to Western blot analysis using anti-SCD1 antibody. α-Tubulin expression was used as a loading control. B, cells were transfected with the indicated siRNA. At 72 h after transfection representative photographs were taken under phase-contrast microscopy. Bar, 200 μm. C, cells were transfected with the indicated siRNA. In the presence or absence of 20 μm Z-VAD-FMK, a pan-caspase inhibitor, cell viability was determined as described under “Experimental Procedures.” Z-FA-FMK, an inactive analog of Z-VAD-FMK, was used as a negative control. The data represent the mean ± S.E. of three experiments. The asterisks indicate significant differences compared with siControl-transfected cells (p < 0.01), the number symbol indicates a significant difference compared with siSCD1-transfected cells that were untreated (p < 0.01), and the dagger indicates a significant difference compared with siSCD1-transfected cells that were treated with Z-FA-FMK (p < 0.01).
FIGURE 2.
FIGURE 2.
SCD1 knockdown induces UPR. HeLa cells were transfected with the indicated siRNA. At 72 h after transfection, total RNA and cell lysates were prepared. A and B, expression of CHOP (A) and GRP78 (B) mRNAs were detected by quantitative real-time PCR. The expression level of each gene was normalized to the GAPDH gene and is represented as -fold induction over siControl. Thapsigargin-treated cells (Tg) were used as a positive control. C, semiquantitative reverse transcription-PCR analysis of XBP1 spliced and unspliced mRNA is shown. The positions of the unspliced form (u) and spliced form (s) are indicated. Thapsigargin-treated cells were used as a positive control. D, shown is an immunoblot analysis of PERK. Thapsigargin-treated cells were used as a positive control, and α-tubulin expression was used as a loading control. The data represent the mean ± S.E. of three experiments. The asterisks indicate significant differences compared with siControl-transfected cells (p < 0.01).
FIGURE 3.
FIGURE 3.
PERK contributes to the cell death induced by SCD1 knockdown. A and B, HeLa cells were transfected with the indicated siRNA. After 72 h, cell lysates were prepared and subjected to Western blot analysis using antibodies against IRE1α (A) and PERK (B). α-Tubulin expression was used as a loading control. siIRE1α and siPERK indicate siRNAs against IRE1α and PERK, respectively. C, cells were transfected with the indicated siRNA. At 66 h after transfection, cell viability was determined as described under “Experimental Procedures.” D, expression of CHOP mRNA was detected by quantitative real-time PCR. The expression level of each gene was normalized to expression of the GAPDH gene and is represented as -fold induction over siControl. The data represent the mean ± S.E. of three experiments. The asterisks indicate significant differences compared with siControl-transfected cells (p < 0.01). The number symbols indicate significant differences compared with siSCD1-transfected cells (p < 0.05).
FIGURE 4.
FIGURE 4.
Polyunsaturated fatty acids suppress UPR induced by SCD1 knockdown. HeLa cells were transfected with the indicated siRNA. 48 h after transfection cells were further incubated for 24 h in media supplemented with the indicated fatty acid (50 μm) and then harvested. A and B, expression of CHOP (A) and GRP78 (B) mRNAs detected by real-time PCR is shown. The expression level of each gene was normalized to the GAPDH gene and is represented as -fold induction over siControl. C, semiquantitative reverse transcription-PCR analysis of XBP1 spliced and unspliced mRNA. The positions of the unspliced form (u) and spliced form (s) are indicated. Thapsigargin-treated cells (Tg) were used as a positive control. The asterisks indicate significant differences compared with siControl-transfected cells (p < 0.01), and the number symbols indicate significant differences compared with siSCD1-transfected cells which were untreated (p < 0.01).
FIGURE 5.
FIGURE 5.
SCD1 knockdown increases palmitic acid-induced UPR. At 48 h after siRNA transfection, cells were further incubated for 12 h in media supplemented with 16:0. The expression level of each gene was normalized to the GAPDH gene and is represented as -fold induction over untreated siControl. The data represent the mean ± S.E. of three experiments. The asterisks indicate significant differences compared with siControl-transfected cells (p < 0.01).
FIGURE 6.
FIGURE 6.
LPCAT3 knockdown enhances SCD1 knockdown-mediated UPR. HeLa cells were transfected with the indicated siRNA. At 66 h after transfection total RNAs were prepared. A and B, expression of CHOP (A) and GRP78 (B) mRNAs were detected by quantitative real-time PCR. The expression level of each gene was normalized to the GAPDH gene and is represented as -fold induction over siControl. siLPCAT1, siLPCAT2, siLPCAT3, siLPCAT4, and siLPIAT1 indicate siRNAs against LPCAT1, LPCAT2, LPCAT3, LPCAT4, and LPIAT1, respectively. C, semiquantitative reverse transcription-PCR analysis of XBP1 spliced and unspliced mRNA. The positions of the unspliced form (u) and spliced form (s) are indicated. Thapsigargin-treated cells (Tg) were used as a positive control. The asterisks indicate significant differences compared with siControl-transfected cells (p < 0.01), and the number symbols indicate significant differences compared with siSCD1-transfected cells (p < 0.01).
FIGURE 7.
FIGURE 7.
LPCAT3 is up-regulated in SCD1 knockdown cells. HeLa cells were transfected with the indicated siRNA. At 66 h after transfection total RNAs were prepared. The expression level of each gene was detected by quantitative real-time PCR. The expression level of each gene was normalized to the GAPDH gene and is represented as -fold induction over siControl. The data represents the mean ± S.E. of three experiments. The asterisks indicate significant differences compared with siControl-transfected cells (p < 0.01).
FIGURE 8.
FIGURE 8.
LPCAT3 knockdown cells are susceptible to palmitic acid exposure. HeLa cells were transfected with the indicated siRNA. At 60 h after transfection cells were further incubated for 12 h in media supplemented with 16:0 (100 μm) and then harvested. A and B, expressions of CHOP (A) and GRP78 (B) mRNAs were detected by quantitative real-time PCR. The expression level of each gene was normalized to the GAPDH gene and is represented as -fold induction over siControl treated with ethanol. C, semiquantitative reverse transcription-PCR analysis of XBP1 spliced and unspliced mRNA is shown. The positions of the unspliced form (u) and spliced form (s) are indicated. Thapsigargin-treated cells (Tg) were used as a positive control. The asterisks indicate significant differences compared with siControl-transfected cells, which were treated with ethanol (p < 0.01).

Similar articles

Cited by

References

    1. Lands W. E., Crawford C. G. (1976) Enzymes of Membrane Phospholipid Metabolism in Animals, 2nd Ed., pp. 3–85, Plenum Press, New York
    1. Holub B. J., Kuksis A. (1978) Adv. Lipid Res 16, 1–125 - PubMed
    1. MacDonald J. I., Sprecher H. (1991) Biochim. Biophys. Acta 1084, 105–121 - PubMed
    1. Spector A. A., Yorek M. A. (1985) J. Lipid Res. 26, 1015–1035 - PubMed
    1. Clandinin M. T., Cheema S., Field C. J., Garg M. L., Venkatraman J., Clandinin T. R. (1991) FASEB J. 5, 2761–2769 - PubMed

Publication types

MeSH terms