. 2010 Aug;7(4):046002.
doi: 10.1088/1741-2560/7/4/046002. Epub 2010 May 20.

Electrocorticographic amplitude predicts finger positions during slow grasping motions of the hand

Affiliations

Electrocorticographic amplitude predicts finger positions during slow grasping motions of the hand

Soumyadipta Acharya et al. J Neural Eng. 2010 Aug.

Abstract

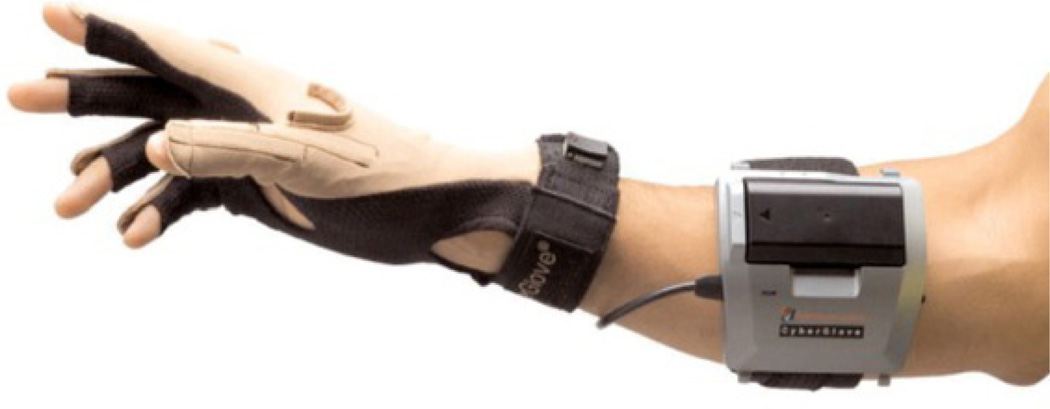
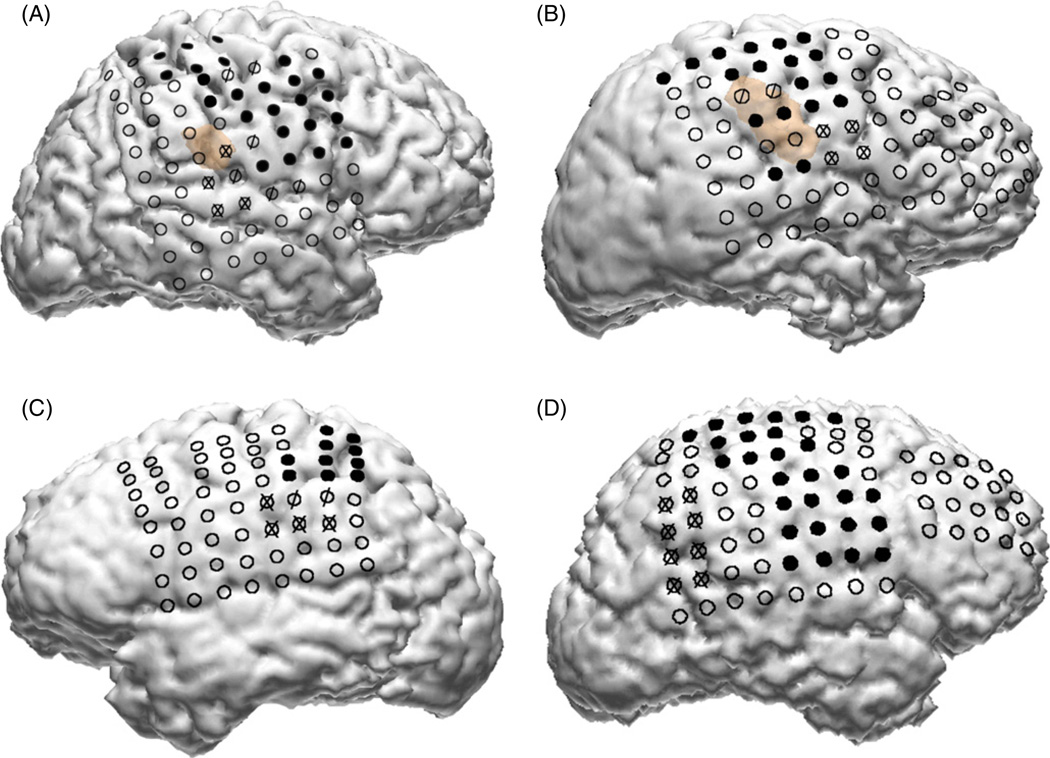
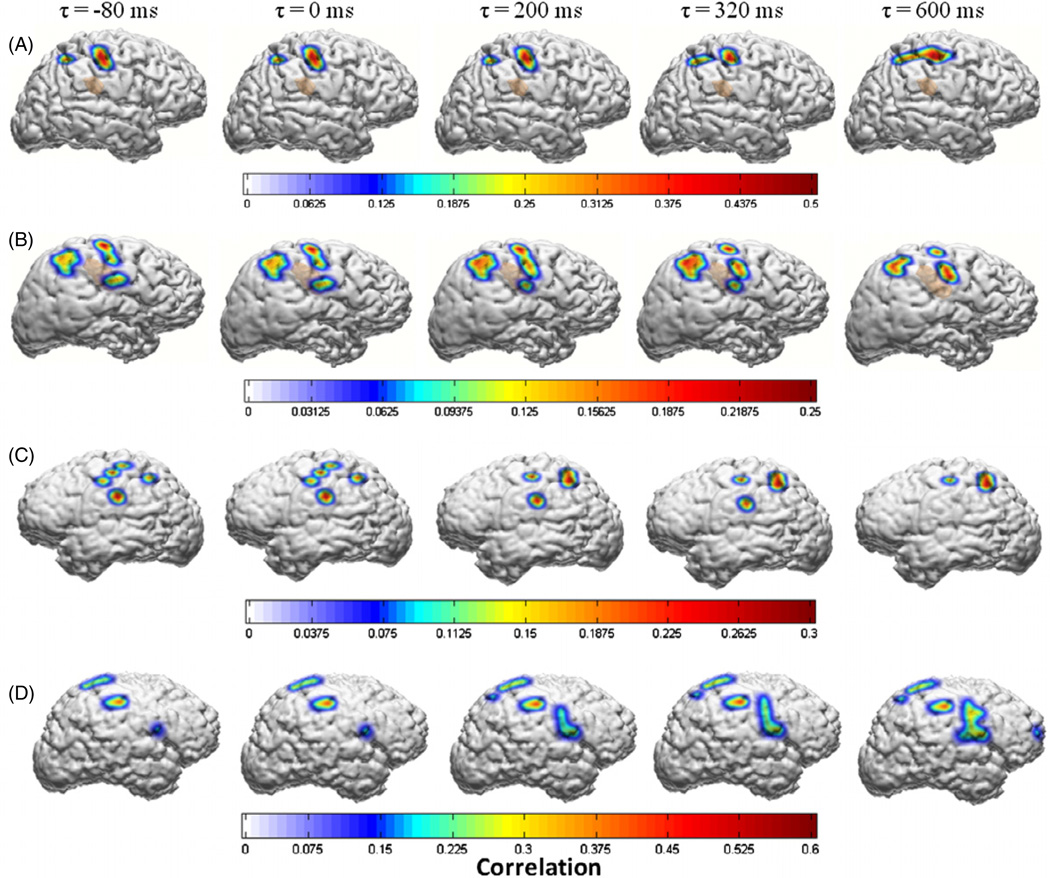
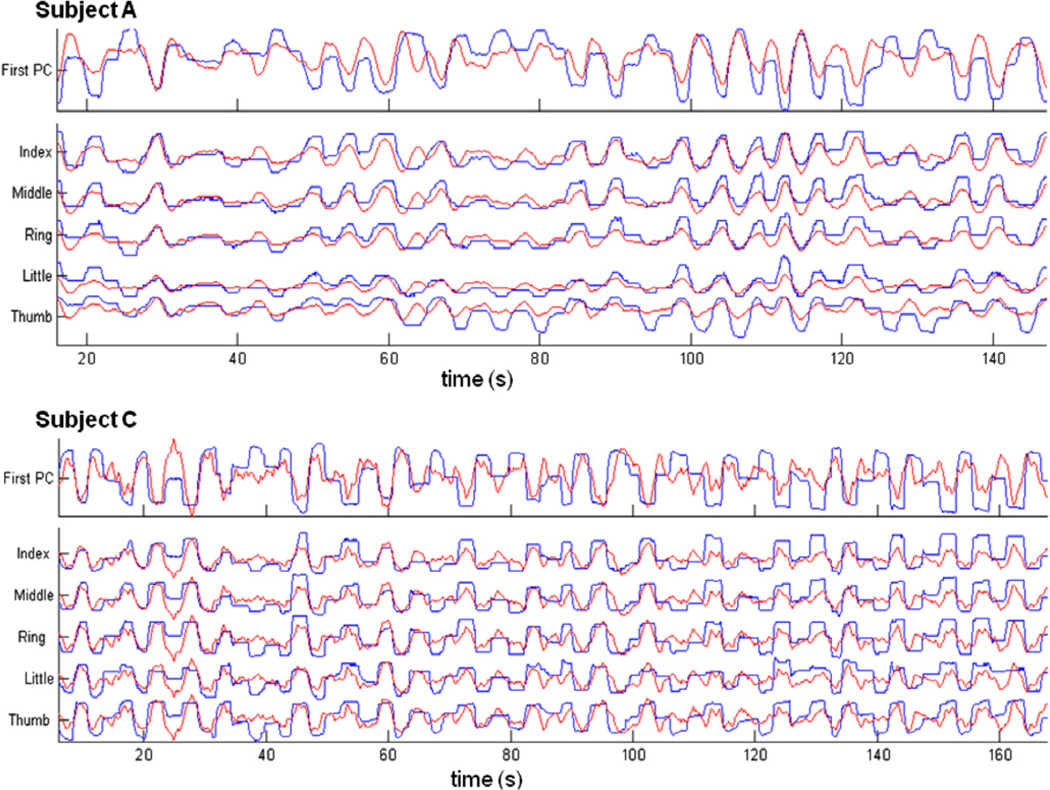
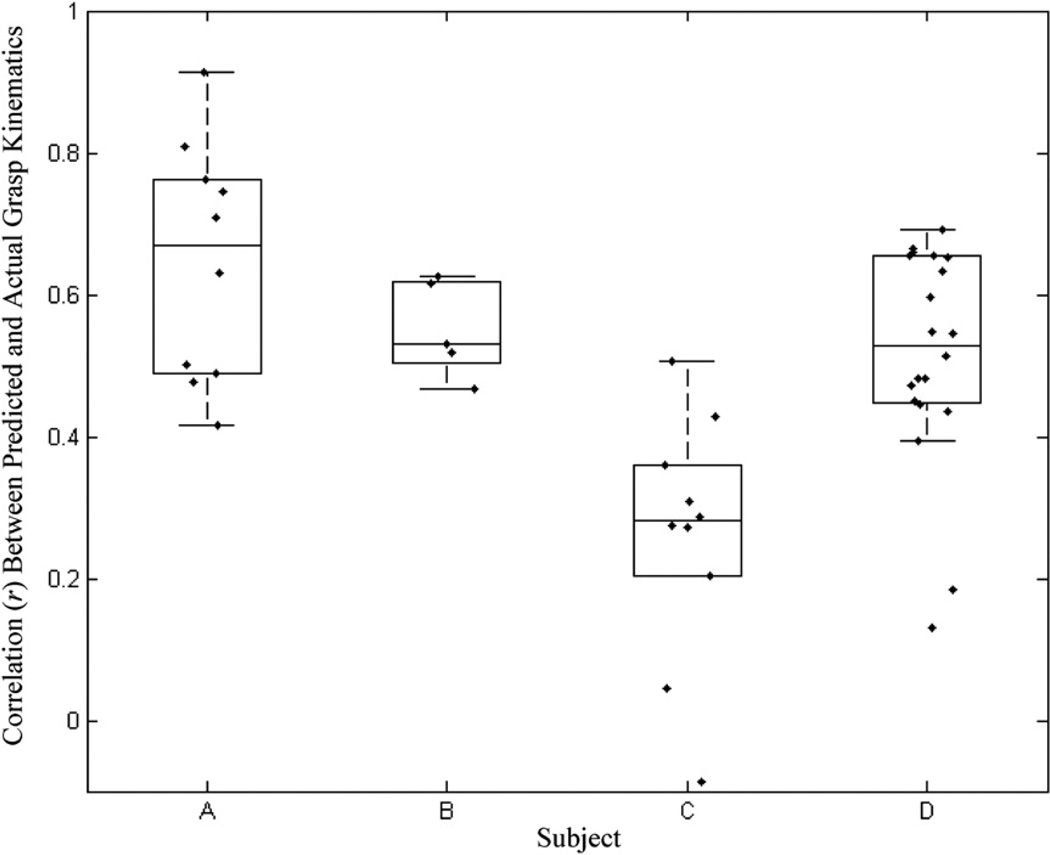
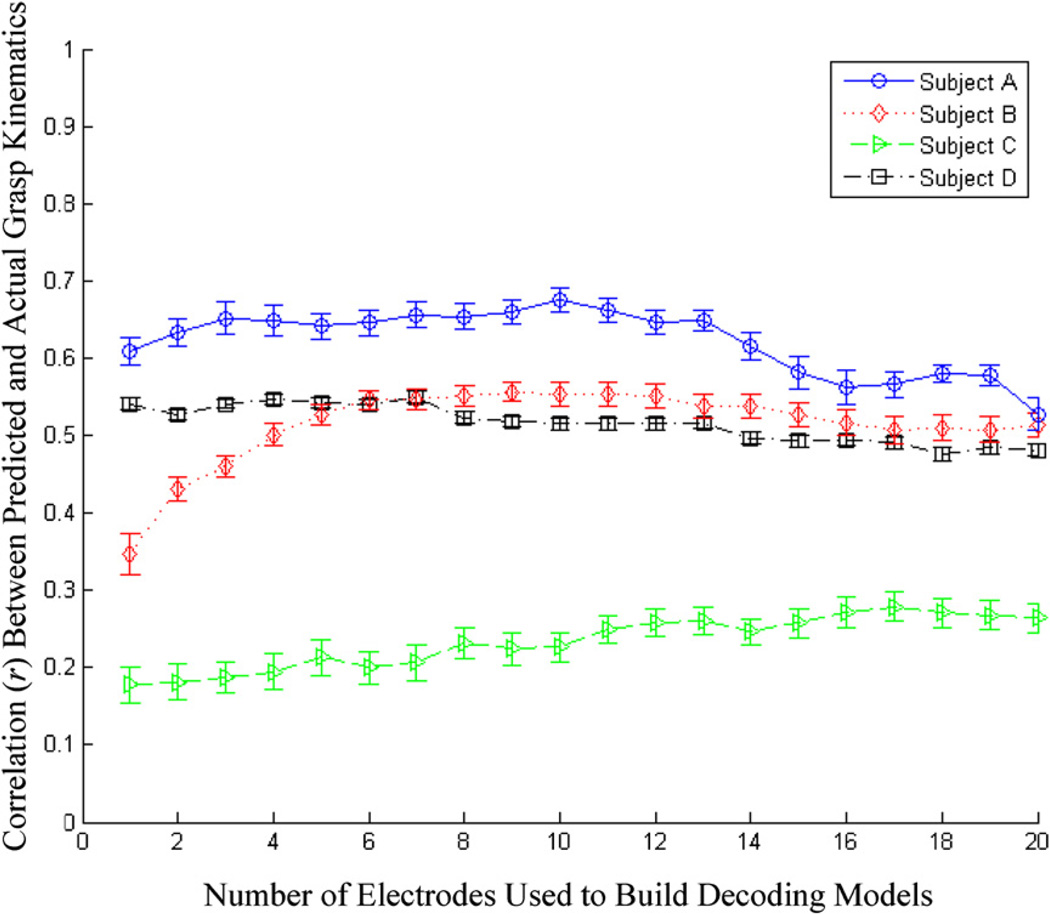
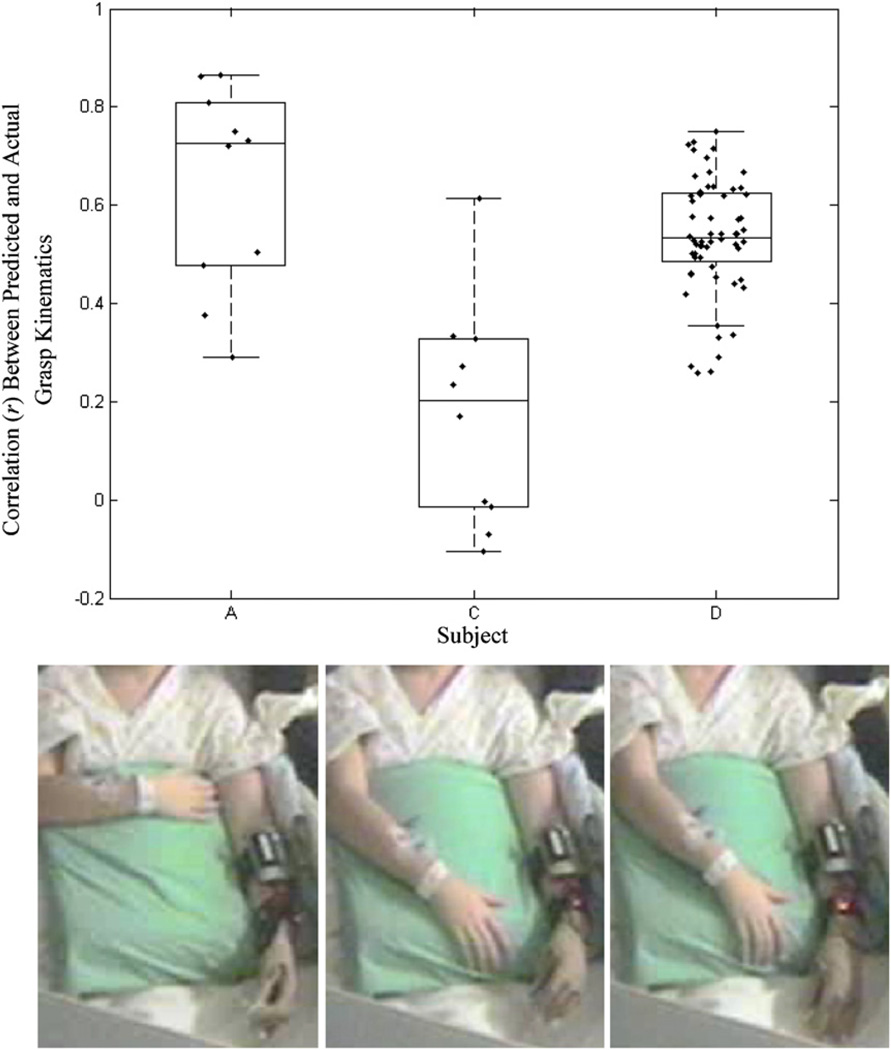
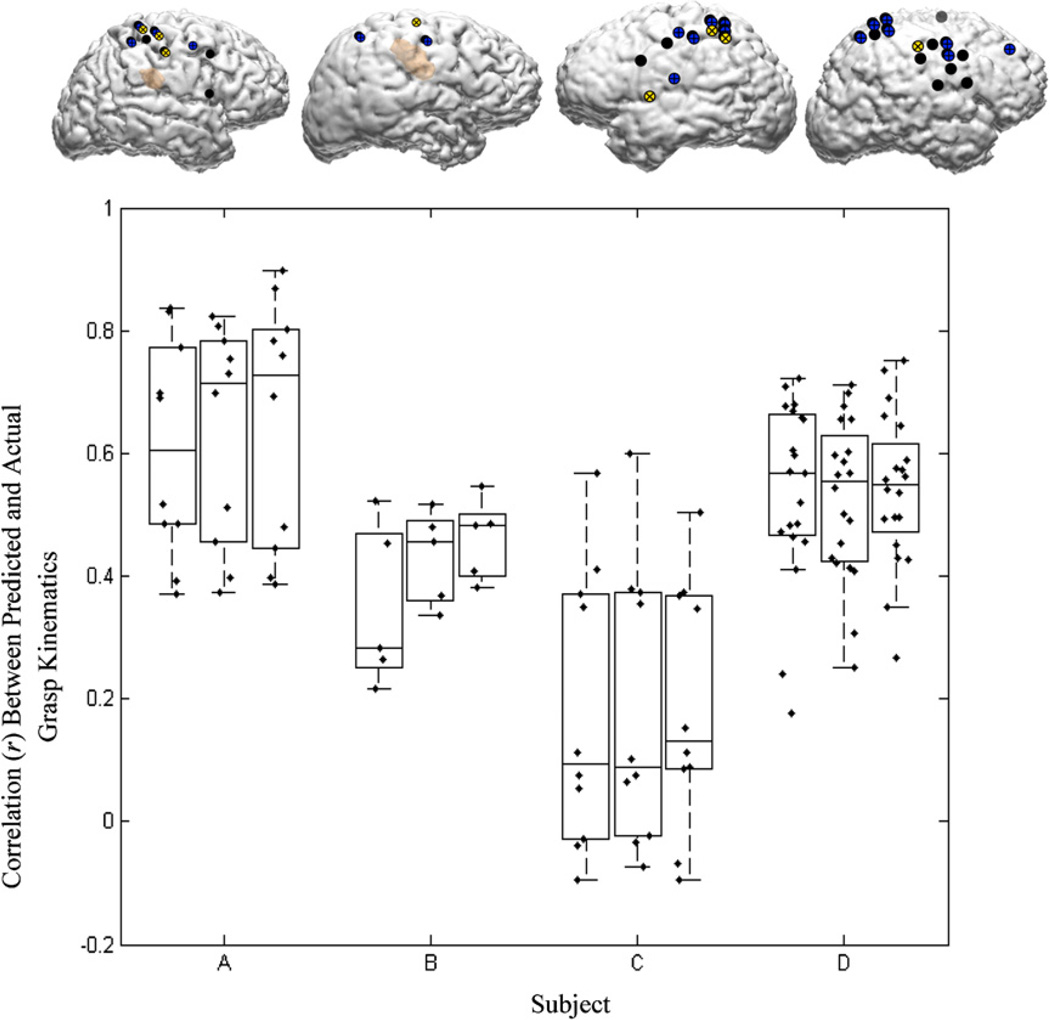
Four human subjects undergoing subdural electrocorticography for epilepsy surgery engaged in a range of finger and hand movements. We observed that the amplitudes of the low-pass filtered electrocorticogram (ECoG), also known as the local motor potential (LMP), over specific peri-Rolandic electrodes were correlated (p < 0.001) with the position of individual fingers as the subjects engaged in slow and deliberate grasping motions. A generalized linear model (GLM) of the LMP amplitudes from those electrodes yielded predictions for positions of the fingers that had a strong congruence with the actual finger positions (correlation coefficient, r; median = 0.51, maximum = 0.91), during displacements of up to 10 cm at the fingertips. For all the subjects, decoding filters trained on data from any given session were remarkably robust in their prediction performance across multiple sessions and days, and were invariant with respect to changes in wrist angle, elbow flexion and hand placement across these sessions (median r = 0.52, maximum r = 0.86). Furthermore, a reasonable prediction accuracy for grasp aperture was achievable with as few as three electrodes in all subjects (median r = 0.49; maximum r = 0.90). These results provide further evidence for the feasibility of robust and practical ECoG-based control of finger movements in upper extremity prosthetics.


Figures

Figure 1
Figure 1
Wireless CyberGlove (Immersion Corp.) for tracking finger and wrist motion. The 18-sensor track flexions and extensions of the distal and proximal interphalangeal joints, metacarpophalangeal joints as well as abductions and adductions of the fingers.
Figure 2
Figure 2
Locations of ECoG grids in the four subjects. In all subjects some portion of the primary motor, supplementary motor and premotor cortices were covered by the grids. Electrodes depicted in solid black are those for which electrical stimulation mapping (ESM) elicited a primary motor response. Electrodes marked with an ‘X’ are those for which ESM elicited a sensory response. Electrodes marked with a ‘/’ had both motor and sensory responses during ESM. The brown background in subjects A and B depicts the location of cortical dysplasias in these subjects.
Figure 3
Figure 3
Spatial distribution of the correlations between the LMPs and the first principal component of finger movements as a function of temporal shift (τ) between the LMPs and the kinematic variable in subjects A, B, C and D, respectively. Only significant values of r (p < 0.01, Bonferroni corrected for multiple pairwise comparisons) are displayed. These figures were generated from a single session of kinematic data (2–3 min) for each subject. For building GLM decoders, subject specific optimal values of ‘τ’ were selected based on the maximal cumulative correlation across all LMPs.
Figure 4
Figure 4
Examples of actual (blue) and predicted (red) finger trajectories in one session each for two high-performing subjects (A and C). The top trace in each plot shows the tracking performance of a linear decoding model to the first PC of finger movement. Subsequent traces show the tracking performance of linear decoding models of the individual fingers. In both these examples, models were trained on the first half of the data and tested on the second half.
Figure 5
Figure 5
Summary of decoding performance in four subjects—A, B, C and D—with GLMs trained on data segments from the same session. Each data point represents the correlation (r) between the actual and predicted kinematics of the first principal component of finger movements. The boxplots surrounding the actual data points depict the median decoding correlation. The whiskers represent 1.5 inter-quartile ranges above and below the median.
Figure 6
Figure 6
Decoding performance in all four subjects as a function the number of ECoG channels used in the respective decoding model. The LMPs were rank ordered in terms of their correlation with the finger movements and GLMs were built by dropping LMP channels from this list. The traces depict the mean decoding correlations between the actual and predicted kinematics with testing data, along with the standard error of the mean (error bars).
Figure 7
Figure 7
(a) Decoding performance of GLMs trained and tested on different sessions with marked variations in wrist rotation, elbow flexion, forearm orientation and across multiple days. The inset pictures (b) depict an example of three separate sessions in subjects C. Note the change in the angle of wrist pronation. GLM decoders were trained on data from one trial and tested on a different trial. The boxplots show the median correlation between the actual and predicted kinematics of the first principal component of finger movements across all cross-trial permutations.
Figure 8
Figure 8
Decoding accuracies achieved with one, two and three ECoG channels (left to right) for each subject. The first, second and third rank-ordered electrodes are depicted on the brain images (yellow = first rank-ordered electrode, blue = second rank-ordered electrode, black = third rank-ordered electrode). The boxplots show the distribution of decoding performances on individual segments of the data from five-fold cross validation, using increasing number of channels (plotted from left to right).

References

    1. Acharya S, Tenore F, Aggarwal V, Etienne-Cummings R, Schieber MH, Thakor NV. Decoding individuated finger movements using volume-constrained neuronal ensembles in the M1 hand area. IEEE Trans. Neural Syst. Rehabil. Eng. 2008;16:15–23. - PMC - PubMed
    1. Aggarwal V, Acharya S, Tenore F, Shin HC, Etienne-Cummings R, Schieber MH, Thakor NV. Asynchronous decoding of dexterous finger movements using M1 neurons. IEEE Trans. Neural Syst. Rehabil. Eng. 2008;16:3–14. - PMC - PubMed
    1. Singhal G, Acharya S, Davidovics N, He J, Thakor N. Including planning activity in feature space distributes activation over a broader neuron population. Conf. Proc. IEEE Eng. Med. Biol. Soc. 2007;2007:5349–5352. - PubMed
    1. Mollazadeh M, Aggarwal V, Singhal G, Law A, Davidson A, Schieber M, Thakor N. Spectral modulation of LFP activity in M1 during dexterous finger movements. Conf. Proc. IEEE Eng. Med. Biol. Soc. 2008;2008:5314–5317. - PMC - PubMed
    1. Hamed SB, Schieber MH, Pouget A. Decoding M1 neurons during multiple finger movements. J. Neurophysiol. 2007;98:327–333. - PubMed