. 2010:2010:354047.
doi: 10.1155/2010/354047. Epub 2010 May 16.

Cytokines and metabolic patterns in pediatric patients with critical illness

Affiliations

Cytokines and metabolic patterns in pediatric patients with critical illness

George Briassoulis et al. Clin Dev Immunol. 2010.

Abstract

It is not known if cytokines, which are cell-derived mediators released during the host immune response to stress, affect metabolic response to stress during critical illness. The aim of this prospective study was to determine whether the metabolic response to stress is related to the inflammatory interleukin-6 (IL-6), 10 (IL-10), and other stress mediators' responses and to assess their relationships with different feeding patterns, nutritional markers, the severity of illness as assessed by the Multiple Organ System Failure (MOSF), the Pediatric Risk of Mortality Score (PRISM), systemic inflammatory response syndrome (SIRS), and mortality in critically ill children. Patients were classified as hypermetabolic, normometabolic, and hypometabolic when the measured resting energy expenditures (REE) were >110%, 90-110% and, <90% of the predicted basal metabolic rate, respectively. The initial predominance of the hypometabolic pattern (48.6%) declined within 1 week of acute stress (20%), and the hypermetabolic patterns dominated only after 2 weeks (60%). Only oxygen consumption (VO(2)) and carbon dioxide production (VCO(2)) (P < .0001) but none of the cytokines and nutritional markers, were independently associated with a hypometabolic pattern. REE correlated with the IL-10 but not PRISM. In the presence of SIRS or sepsis, CRP, IL-6, IL-10, Prognostic Inflammatory and Nutritional Index (NI), and triglycerides--but not glucose, VO(2), or VCO(2) increased significantly. High IL-10 levels (P = .0000) and low measured REE (P = .0000) were independently associated with mortality (11.7%), which was higher in the hypometabolic compared to other metabolic patterns (P < .005). Our results showed that only VO(2) and VCO(2), but not IL-6 or IL-10, were associated with a hypometabolic pattern which predominated the acute phase of stress, and was associated with increased mortality. Although in SIRS or sepsis, the cytokine response was reliably reflected by increases in NI and triglycerides, it was different from the metabolic (VO(2), VCO(2)) or glucose response.


Figures
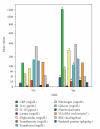
Figure 1
Figure 1
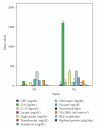
Comparison of metabolic monitor measurements, cytokines, and nutritional markers between patients with and without systemic inflammatory response syndrome (SIRS) (scale type power: exponent 0.5). In the presence of SIRS significantly increased (*) were: C-Reactive Protein (CRP), Interleukin-6 (IL-6), Interleukin-10 (IL-10), nutritional index, and triglycerides (t-test for unpaired data). Significantly decreased (#) despite a higher protein intake: transferrin and transthyretin. Did not differ compared to the non-SIRS patients: lactate, glucose, fibrinogen, Oxygen Consumption (VO2), and Resting Energy Expenditure (REE). BSA: Body Surface Area.
Figure 2
Figure 2
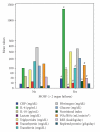
Comparison of metabolic monitor measurements, various cytokines, and nutritional markers between patients with and without sepsis (scale type power: exponent 0.5). Significantly increased (*) in the presence of sepsis: C-Reactive Protein (CRP), Interleukin-6 (IL-6), Interleukin-10 (IL-10), nutritional index, and triglycerides (t-test for unpaired data). Significantly decreased (#) despite a higher protein intake: transferrin and transthyretin. Did not differ compared to the nonsepsis patients: lactate, glucose, fibrinogen, Oxygen Consumption (VO2), and Resting Energy Expenditure (REE). BSA: Body Surface Area.
Figure 3
Figure 3
Comparison of metabolic monitor measurements, various cytokines, and nutritional markers between patients with and without multiple organ system failure (MOSF) (scale type power: exponent 0.5). Significantly increased (*) in the presence of MOSF: C-Reactive Protein (CRP), Interleukin-6 (IL-6), Interleukin-10 (IL-10), nutritional index, and lactate (t-test for unpaired data). Significantly decreased (#) despite a higher protein intake: Oxygen Consumption (VO2), Resting Energy Expenditure (REE), transferrin and transthyretin. Did not differ compared to the non-MOSF patients: triglycerides, glucose, fibrinogen. BSA: Body Surface Area.
Figure 4
Figure 4
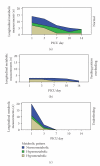
Longitudinal distribution of metabolic patterns in children during the acute phase of stress. The predominance of the hypometabolic pattern (50%) declined within 1 week of acute stress (20%) and the hypermetabolic patterns dominated only after 2 weeks (60%). Paired Resting Energy Expenditure (REE) and Predicted Basal Metabolic Rate (PBMR) measurements (n = 37). PICU: Pediatric Intensive Care Unit.
Figure 5
Figure 5
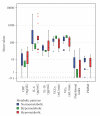
Only Oxygen consumption (VO2) and carbon dioxide production (VCO2) differed significantly among metabolic patterns (ANOVA, Bonferroni post-hoc tests, P < .0001). None of the cytokines and nutritional markers differed between the metabolic patterns. Note the (nonsignificant) lower trend of the Pediatric Risk of Mortality Score (PRISM) and C-Reactive Protein (CRP) values in the hypermetabolic group of patients. The Box-whisker plots show the median (horizontal line within the box) and the 10th and 90th percentiles (whiskers). The box length is the interquartile range (logarithmic scale). Solid circles represent outliers, stars extremes. IL-6: Interleukin-6, IL-10: Interleukin-10.
Figure 6
Figure 6
Mortality was (i) significantly higher (Pearson chi-square, asymptomatic significance 2-sided P < .05) in the hypometabolic pattern (22.6%) compared to the hypermetabolic (6.7%) or normometabolic patterns (3.2%), (ii) exclusively restricted to patients with Pediatric Risk of Mortality Score (PRISM)>10 (25.7% versus 0, P < .0001), and (iii) increased among those receiving partial or Total Parenteral Nutrition (TPN) (20% versus 6.4%, P = .7).
Figure 7
Figure 7
Opposite trends of C-Reactive Protein (CRP), Interleukin-10 (IL-10), and nutritional index compared to transferrin, and Resting Energy Expenditure (REE) were recorded between survivors and non-survivors.
Figure 8
Figure 8
(a) Only the respiratory quotient (RQ) varied at higher levels in the overfeeding compared to the other groups (ANOVA, Bonferroni post-hoc tests, P < .0001); (b) Nutritional and stress indices did not differ among feeding groups during the acute phase of stress. The Box-whisker plots show the median (horizontal line within the box), and the 10th and 90th percentiles (whiskers). The box length is the interquartile range (logarithmic scale). Solid circles represent outliers. REE: Resting Energy Expenditure, VO2: Oxygen Consumption, VCO2: Carbon Dioxide production, BSA: Body Surface Area, IL-6: Interleukin-6, IL-10: Interleukin-10.

References

    1. Kamimura MA, Draibe SA, Dalboni MA, et al. Serum and cellular interleukin-6 in haemodialysis patients: relationship with energy expenditure. Nephrology Dialysis Transplantation. 2007;22(3):839–844. - PubMed
    1. Proulx F, Joyal JS, Mariscalco MM, Leteurtre S, Leclerc F, Lacroix J. The pediatric multiple organ dysfunction syndrome. Pediatric Critical Care Medicine. 2009;10(1):12–22. - PubMed
    1. Cvijanovich NZ, King JC, Flori HR, Gildengorin G, Wong HR. Zinc homeostasis in pediatric critical illness. Pediatric Critical Care Medicine. 2009;10(1):29–34. - PubMed
    1. Hager P, Permert J, Wikström A-C, Herrington MK, Östenson C-G, Strömmer L. Preoperative glucocorticoid administration attenuates the systemic stress response and hyperglycemia after surgical trauma in the rat. Metabolism. 2009;58(4):449–455. - PubMed
    1. American College of Chest Physicians/Society of Critical Care Medicine Consensus Conference. Definitions for sepsis and organ failure and guidelines for the use of innovative therapies in sepsis. Critical Care Medicine. 1992;20:864–874. - PubMed

MeSH terms