. 2010 Jul;31(1):59-69.
doi: 10.1007/s10974-010-9208-7. Epub 2010 May 20.

Analysing force-pCa curves

Affiliations

Analysing force-pCa curves

John S Walker et al. J Muscle Res Cell Motil. 2010 Jul.

Abstract

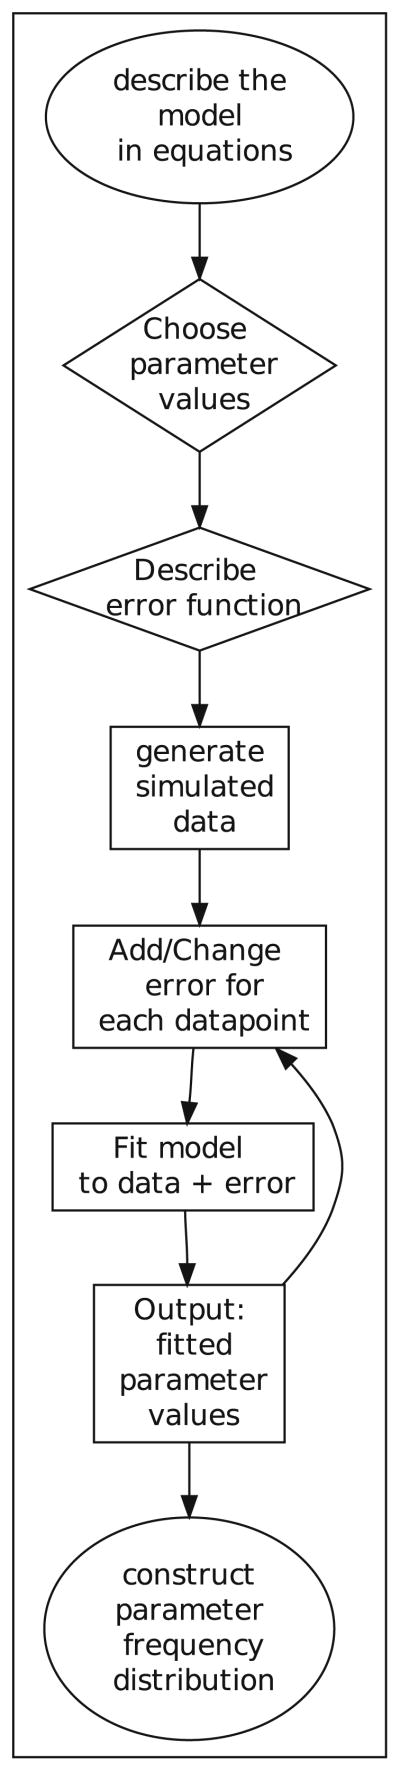
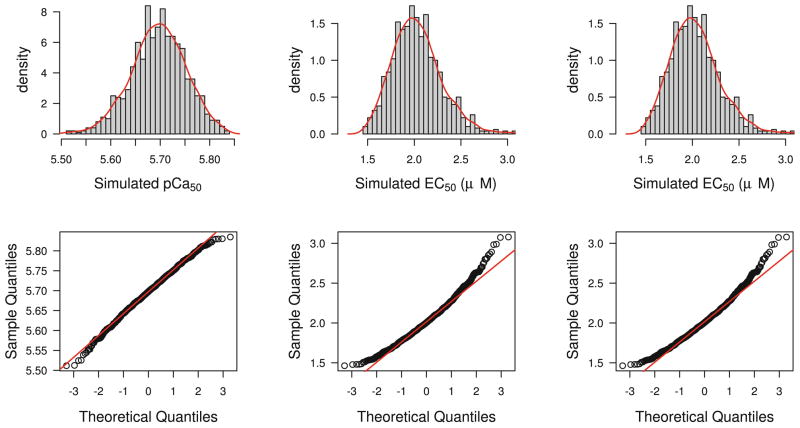
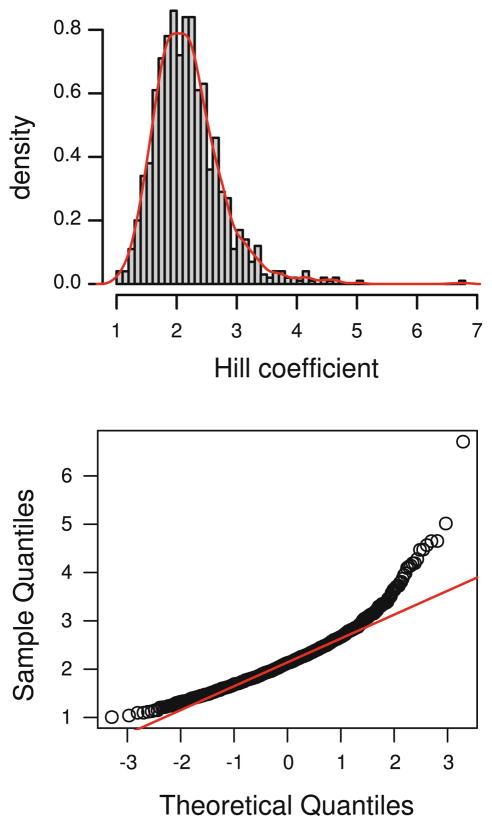
We investigated three forms of the Hill equation used to fit force-calcium data from skinned muscle experiments; Two hyperbolic forms that relate force to calcium concentration directly, and a sigmoid form that relates force to the -log(10) of the calcium concentration (pCa). The equations were fit to force-calcium data from 39 cardiac myocytes (up to five myocytes from each of nine mice) and the Hill coefficient and the calcium required for half maximal activation, expressed as a concentration (EC(50)) and as a pCa value (pCa(50)) were obtained. The pCa(50) values were normally distributed and the EC(50) values were found to approximate a log-normal distribution. Monte Carlo simulations confirmed that these distributions were intrinsic to the Hill equation. Statistical tests such as the t-test are robust to moderate levels of departure from normality as seen here, and either EC(50) or pCa(50) may be used to test for significant differences so long as it is kept in mind that ΔEC₅₀ is an additive measure of change and that ΔpCa₅₀ is a ratiometric measure of change. The Hill coefficient was found to be sufficiently log-normally distributed that log-transformed values should be used to test for statistically significant differences.


Figures

Fig. 1
Fig. 1
This figure describes the steps used to construct the Monte Carlo simulation used to model the distribution of EC50 and pCa50 in fits of a Hill equation to the data. The figure was adapted from Christopoulos (1998)
Fig. 2
Fig. 2
The results of each experiment with the fitted force–pCa curve used to calculate the distribution of pCa50. The curves were fitted to normalised force data. The number above each data set is the experiment number, a space and the myocyte number
Fig. 3
Fig. 3
Distribution of pCa50 and EC50 (in μM) from curves fitted to force–calcium data from 39 experiments. The equations used to fit the data are given in the top row. The histograms are density histograms where the y-axis displays the relative frequency density. The product of the dimensions of a individual bar is the relative frequency and the total area under the histogram is 1. a Density histogram and overlaid density function for pCa50 data. b Density histogram and overlaid density function for EC50 from the same data as (a) fitted to Eq. 2. c Density histogram and overlaid density function for fit for EC50 values calculated from K and the Hill coefficient from fits of the original Hill equation to the experimental data. df QQ plots comparing distribution of pCa50 and EC50 data (y-axis) from ac to a normal distribution (x-axis) in each case the line is drawn through the 1st and 3rd quartiles
Fig. 4
Fig. 4
The distribution of the Hill coefficient from the fit of the data to the modified Hill equation. Top left A relative density histogram of the Hill coefficient values from 39 fitted curves. Bottom left A QQ plot of the Hill coefficient values against a normal distribution. The distribution is positively skewed. Top right A relative density histogram of the log-transformed Hill coefficients from fits to the experimental data and a probability density function overlaid on top of it. Bottom right A QQ plot of the Hill coefficient values against a normal distribution. The distribution of the log-transformed values is more symmetrical than the distribution of raw values and is likely to be sufficiently close to normal for t-tests and ANOVAs
Fig. 5
Fig. 5
The distribution of pCa50 (left) and EC50 (center and right) from fits to 1,000 simulated data sets. Represented as relative frequency histograms (upper row) and as QQ plots (lower row). The distribution of pCa50 is slightly negatively skewed while the distribution of EC50 is slightly positively skewed
Fig. 6
Fig. 6
Histograms of EC50 values when the calcium concentrations used to create the force–calcium curve are evenly spaced (top) or logarithmically spaced (bottom). Red lines on each panel indicate overlaid probability density functions. The blue line in the bottom panel indicates the probability density distribution represented in the top panel. The simulation used the same parameters, range of concentrations and number of data points except that the datapoints were evenly spaced in concentration for the top panel and logarithmically spaced in the bottom panel. The EC50 distribution from evenly spaced data points is marginally less skewed than the distribution from logarithmically spaced data points (Color figure online)
Fig. 7
Fig. 7
Relative frequency histogram (top) and QQ plot (bottom) of Hill coefficient values from fits to 1,000 simulated datasets. The QQ-plot is against quantiles of the normal distribution

References

    1. Best PM, Donaldson SK, Kerrick WG. Tension in mechanically disrupted mammalian cardiac cells: effects of magnesium adenosine triphosphate. J Physiol. 1977;265(1):1–17. - PMC - PubMed
    1. Bindslev N. Drug–acceptor interactions. Co-Action Publishing; Sweden: 2008.
    1. Box G, Watson G. Robustness to non-normality of regression tests. Biometrika. 1962;49:93–106.
    1. Brandt PW, Cox RN, Kawai M. Can the binding of Ca2+ to two regulatory sites on troponin C determine the steep pCa/tension relationship of skeletal muscle? Proc Natl Acad Sci USA. 1980;77(8):4717–4720. - PMC - PubMed
    1. Brown D, Rothery P. Models in biology: mathematics, statistics and computing. Wiley; Chichester: 1993.

Publication types

LinkOut - more resources