Multicenter Study
. 2010 Jul 1;161(1):98-107.
doi: 10.1111/j.1365-2249.2010.04152.x. Epub 2010 May 10.

Low thymic output in the 22q11.2 deletion syndrome measured by CCR9+CD45RA+ T cell counts and T cell receptor rearrangement excision circles

Affiliations
Multicenter Study

Low thymic output in the 22q11.2 deletion syndrome measured by CCR9+CD45RA+ T cell counts and T cell receptor rearrangement excision circles

K Lima et al. Clin Exp Immunol. .

Abstract

Thymic hypoplasia is a frequent feature of the 22q11.2 deletion syndrome, but we know little about patients' age-related thymic output and long-term consequences for their immune system. We measured the expression of T cell receptor rearrangement excision circles (TREC) and used flow cytometry for direct subtyping of recent thymic emigrant (RTE)-related T cells in 43 patients (aged 1-54 years; median 9 years) from all over Norway and in age-matched healthy controls. Thymic volumes were estimated by ultrasound in patients. TREC levels correlated well with RTE-related T cells defined by co-expression of CD3, CD45RA and CCR9 (r=0.84) as well as with the CD4+ and CD8+ T cell subtypes. RTE-related T cell counts also paralleled age-related TREC reductions. CD45RA+ T cells correlated well with absolute counts of CD4+ (r=0.87) and CD8+ (r=0.75) RTE-related T cells. Apart from CD45RA- T cells, all T cell subsets were lower in patients than in controls. Thymic volumes correlated better with RTE-related cells (r=0.46) than with TREC levels (r=0.38). RTE-related T cells and TREC levels also correlated well (r=0.88) in patients without an identifiable thymus. Production of RTEs is impaired in patients with a 22q11.2 deletion, and CCR9 appears to be a good marker for RTE-related T cells.


Figures

Fig. 1
Fig. 1
Flow cytometric dot plots and compounded data curves from patients and controls. Dot plots (a–h) of peripheral blood T cells expressing CD45RA and CCR9 from patients (b, d, f, h) and controls (a, c, e, g) of children (a, e: 2·9 years; b, f: 3·3 years) and adults (c, g and d, h: both 38 years) for both the CD4+ (a–d) and CD8+ (e–h) subsets. Percentages of cells in each quadrant are shown in the upper right corner of each plot. Cursor positions were set from negative controls obtained from parallel samples of each patient and control using concentration- and isotype-matched irrelevant antibodies. Compounded flow data of absolute (i–q) and relative (r–t) counts of T cell populations from peripheral blood of patients (○) and controls (▴) versus age are shown. Absolute counts are shown for CD3+ (i), CD3+CD4+ (j), and CD3+CD8+ (k) cells and their CD45RA+ (l–n) and CD45RA+CCR9+ (o–q) subsets. In addition, percentages of CD45RA+CCR9+ cells among CD3+ (r) CD3+CD4+ (s) and CD3+CD8+ (t) cells are shown. Note different axis scales between plots and axis breaks in (o–t). Curves were fitted using non-linear regression analysis for patients (grey lines) and controls (black lines). Wilcoxon matched-pairs signed-rank sum test was used for testing between patients and controls and corresponding P-values are shown.
Fig. 2
Fig. 2
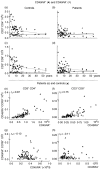
CD45RA+ and CD45RA T cells versus age and CD45RA+CCR9+ T cells. Absolute counts are shown for CD4+ (a, b) and CD8+ (c, d) subsets of CD45RA+ (♦) and CD45RA (◊) T cells from patients (b, d) and controls (a, c) versus age. Curves were fitted using non-linear regression analysis for both CD45RA+ (grey lines) and CD45RA (black lines) T cells. Correlation for patients (○) and controls (▴) of absolute counts of CD45RA+ (e, f) and CD45RA (g, h) cells with absolute counts of CD45RA+CCR9+ cells among CD3+CD4+ (e, g) and CD3+CD8+ (f, h) cells. Note different axis scales between plots and axis breaks in (e–h). Spearman's rank correlation coefficient (rs) is shown as indicated.
Fig. 3
Fig. 3
T cell receptor rearrangement excision circles (TRECs) related to age and counts of CD45RA+CCR9+ T cell subsets. (a–d) TREC versus age (a) and absolute counts of CD45RA+CCR9+ cells among CD3+ (b), CD3+CD4+ (c) and CD3+CD8+ (d) cells from peripheral blood of patients (○) and controls (▴). Non-linear regression analysis curves for TRECs versus age are shown for patients (grey) and controls (black) in (a). Note different axis scales between plots and axis breaks in (b–d). The P-value from Wilcoxon matched-pairs signed-rank sum test (p) is shown in (a), and Spearman's rank correlation coefficient (rs) with corresponding P-values for the correlations are shown in (b–d).
Fig. 4
Fig. 4
Thymic volume of patients related to age, T cell receptor rearrangement excision circles (TRECs) and CD45RA+CCR9+ T cells. Data from patients only: estimated thymic volumes of patients ≤8 (•) and >8 (○) years versus age (a), TRECs (b) and absolute counts of peripheral blood CD45RA+CCR9+ T cells (c). Only patients where thymic tissue was found in its normal anatomical place (thymus found) are included in (a, b, c). TREC versus absolute counts of peripheral blood CD45RA+CCR9+ T cells for patients without an orthotopic thymic tissue (no thymus) are shown in (d). Note different axis scales between plots and axis breaks in (a–c). Spearman's rank correlation coefficient (rs) and P-values for the corresponding correlations (p) are shown in (b–d).

References

    1. Scambler PJ, Kelly D, Lindsay E, et al. Velo-cardio-facial syndrome associated with chromosome 22 deletions encompassing the DiGeorge locus. Lancet. 1992;339:1138–9. - PubMed
    1. Halford S, Wadey R, Roberts C, et al. Isolation of a putative transcriptional regulator from the region of 22q11 deleted in DiGeorge syndrome, Shprintzen syndrome and familial congenital heart disease. Hum Mol Genet. 1993;2:2099–107. - PubMed
    1. Botto LD, May K, Fernhoff PM, et al. A population-based study of the 22q11.2 deletion: phenotype, incidence, and contribution to major birth defects in the population. Pediatrics. 2003;112:101–7. - PubMed
    1. Driscoll DA, Salvin J, Sellinger B, et al. Prevalence of 22q11 microdeletions in DiGeorge and velocardiofacial syndromes: implications for genetic counselling and prenatal diagnosis. J Med Genet. 1993;30:813–17. - PMC - PubMed
    1. Oskarsdottir S, Vujic M, Fasth A. Incidence and prevalence of the 22q11 deletion syndrome: a population-based study in Western Sweden. Arch Dis Child. 2004;89:148–51. - PMC - PubMed

Publication types

MeSH terms