

Dynamics of fat absorption and effect of sham feeding on postprandial lipema
- PMID: 20493191
- PMCID: PMC2948783
- DOI: 10.1053/j.gastro.2010.05.002
Dynamics of fat absorption and effect of sham feeding on postprandial lipema
Abstract
Background & aims: Given the importance of postprandial hyperlipidemia to increase risk for atherosclerosis, in the present study, stable isotope-labeled meals were fed to healthy subjects (7 males and 3 females) to investigate the kinetics chylomicron synthesis and the effect of sensory exposure to lipid on metabolism.
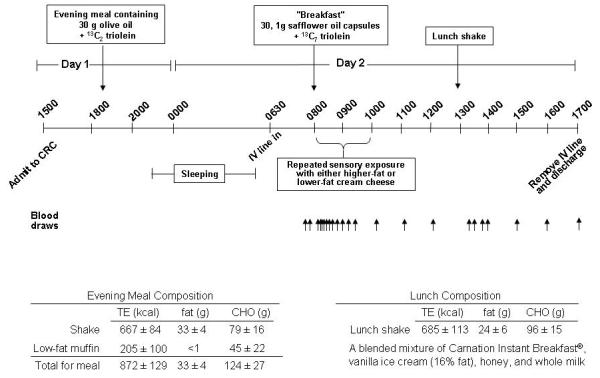
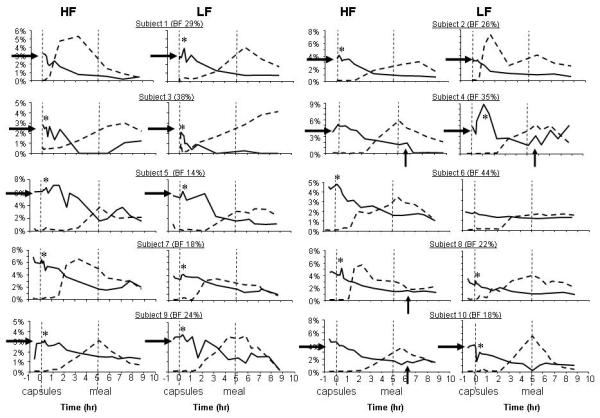
Methods: Subjects performed two, 24-hour inpatient studies that entailed consumption of a liquid formula evening meal containing 30 g of oil (+ (13)C(2) triolein) on day 1. Breakfast (day 2) consisted of triacylglycerols (TAGs) fed as capsules (30 g oil + (13)C(7) triolein) to avoid activation of mouth taste receptors. Next, modified sham feeding of cream cheese occurred over 2 hours. In the 2 trials, the stimulus was either higher fat (HF) or lower fat (LF) cream cheese. A liquid meal was consumed at lunch. Blood sampling occurred intermittently, and chylomicron particles S(f) >400 TAGs were analyzed by gas chromatography-mass spectrometry.
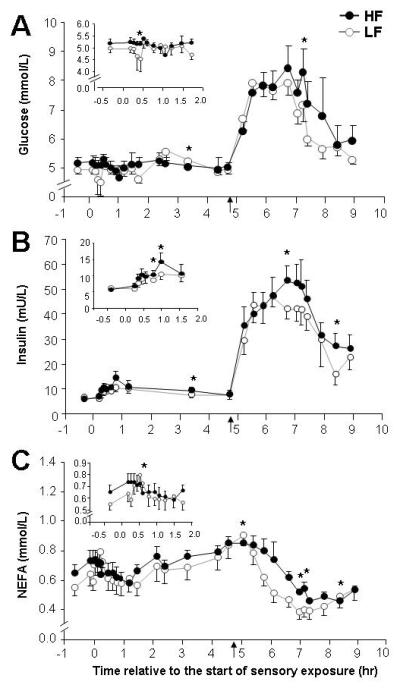
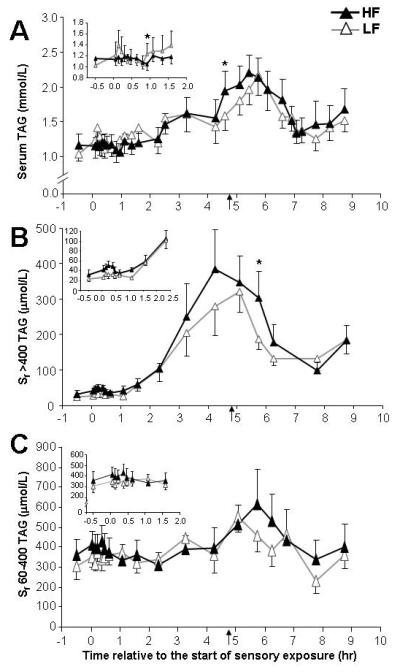
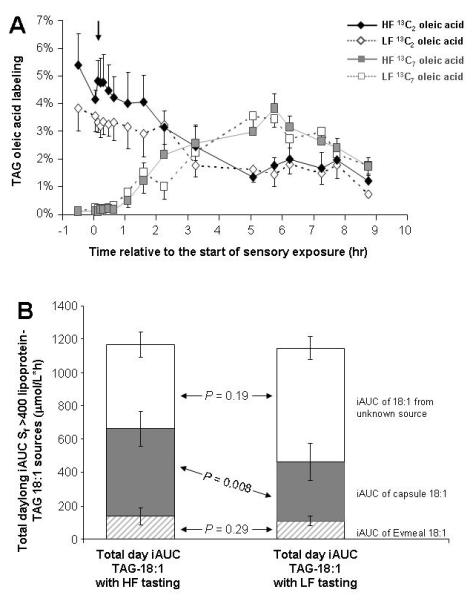
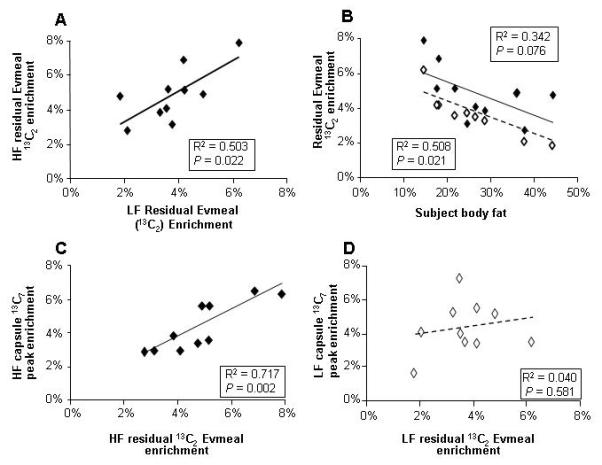
Results: (13)C(2)-Label was found in fasting-state lipoproteins, and persons with higher body fat percentages showed greater dilution of meal TAGs from endogenous sources. For both trials, 13% ± 4% of lipoprotein TAGs oleic acid was derived from the previous evening meal. Incremental area under the curve for TAGs during HF was ∼2.5 times higher than after LF exposure (46 ± 15 vs 17 ± 5 μmol/L/h; P = .04). The greater HF morning lipemia occurred with elevated glucose, insulin, and nonesterified fatty acids peak after lunch.
Conclusions: These data support a connection between enteral lipid metabolism and oral fat exposure, resulting in elevated postprandial lipemia. The results suggest that the intestine may participate in a mechanism coordinating oral fat signaling with control of subsequent macronutrient disposal in the body.
Copyright © 2010 AGA Institute. Published by Elsevier Inc. All rights reserved.
Figures
References
-
- Zafra M, Molina F, Puerto A. The neural/cephalic reflexes in the physiology of nutrition. Neuroscience and Behavior Reviews. 2006;30:1032–1044. - PubMed
-
- Mattes RD. Physiologic responses to sensory stimulation by food: nutritional implications. J Am Diet Assoc. 1997;97:406–413. - PubMed
-
- Gilbertson TA, Fontenot DT, Liu L, et al. Fatty acid modulation of K+ channels in taste receptor cells: gustatory cues for dietary fat. Am J Physiol. 1997;272:C1203–C1210. - PubMed
-
- Gaillard D, Laugerette F, N. D, El-Yassimi A, et al. The gustatory pathway is involved in CD36-mediated orosensory perception of long-chain fatty acids in the mouse. FASEB J. 2008;22:1458–1468. - PubMed
Publication types
MeSH terms
Substances
Grants and funding
LinkOut - more resources
Full Text Sources
Medical
Research Materials
Miscellaneous
