. 2010 May 28;141(5):884-96.
doi: 10.1016/j.cell.2010.03.054. Epub 2010 May 20.

Ligand-specific c-Fos expression emerges from the spatiotemporal control of ErbB network dynamics

Affiliations

Ligand-specific c-Fos expression emerges from the spatiotemporal control of ErbB network dynamics

Takashi Nakakuki et al. Cell. .

Abstract

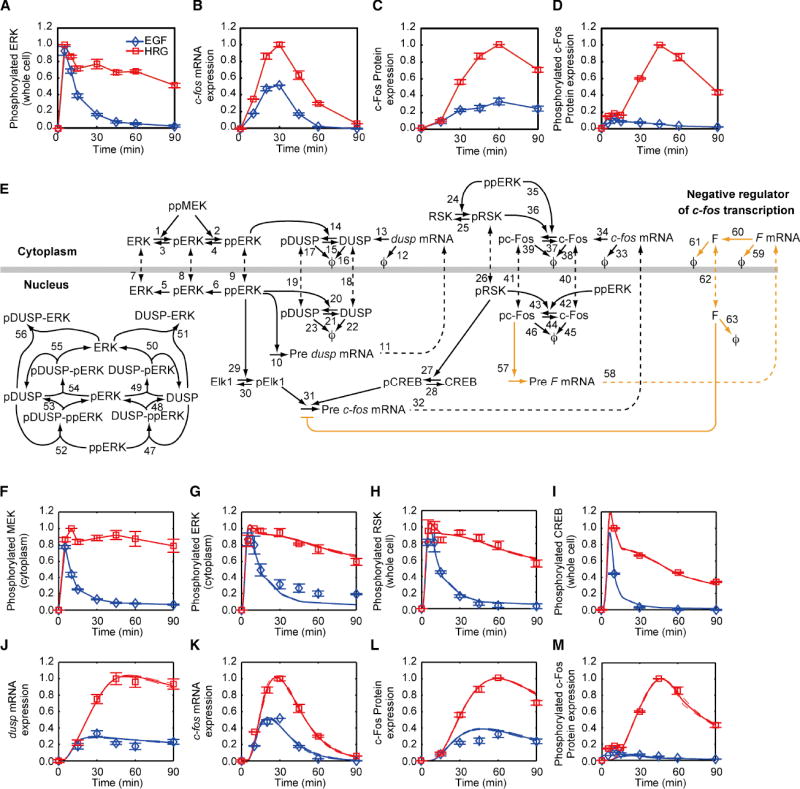
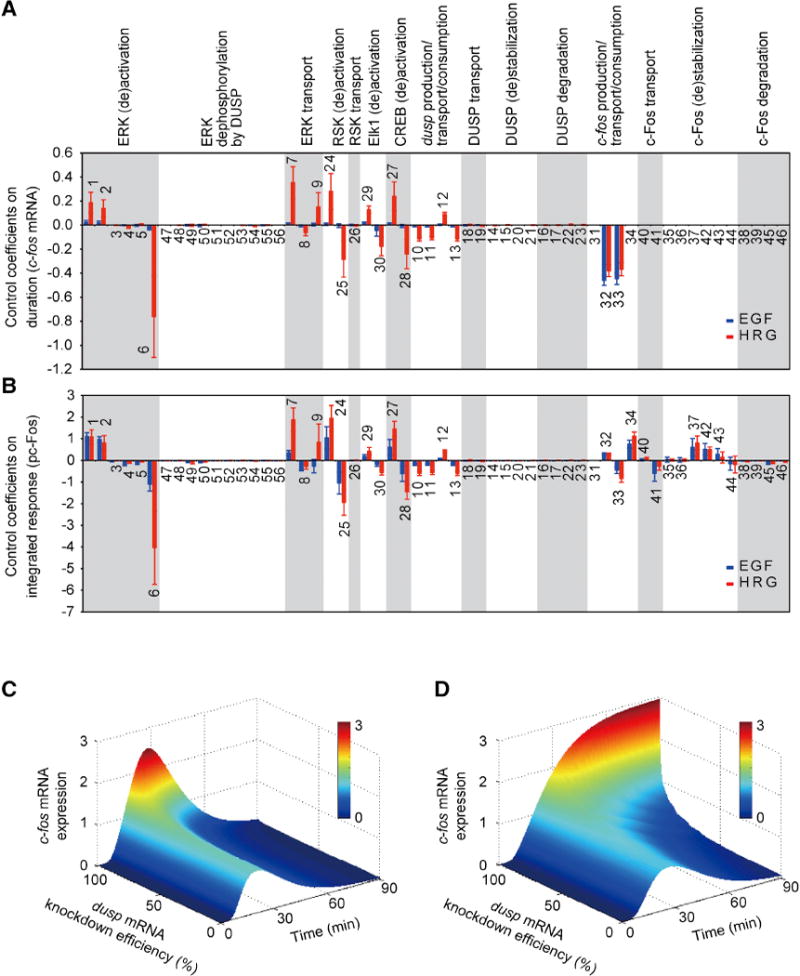
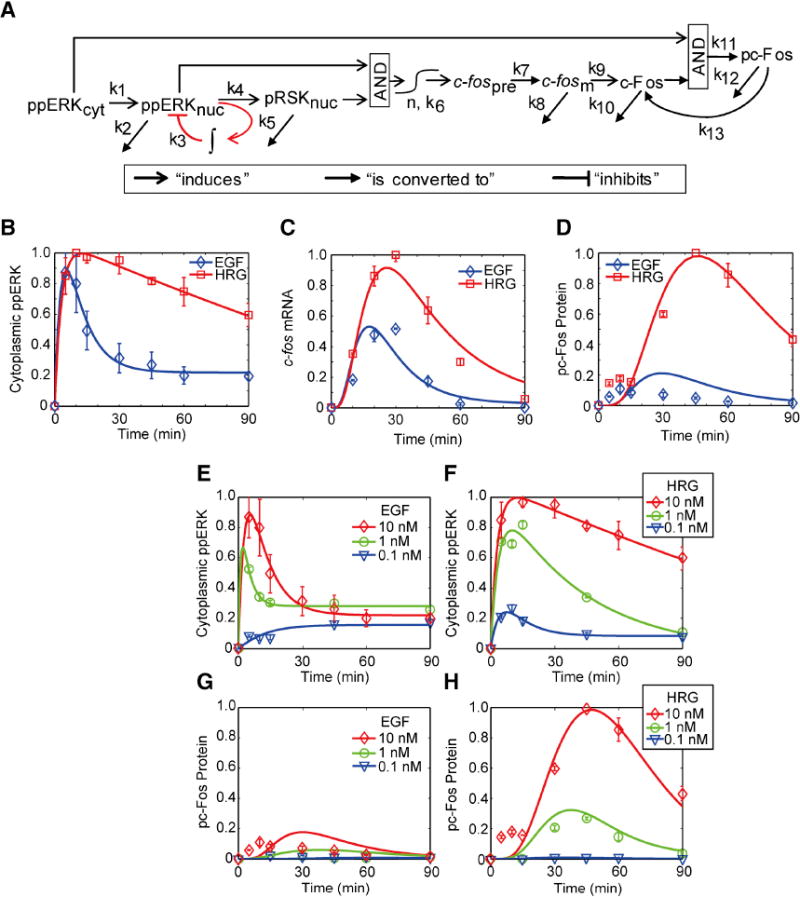
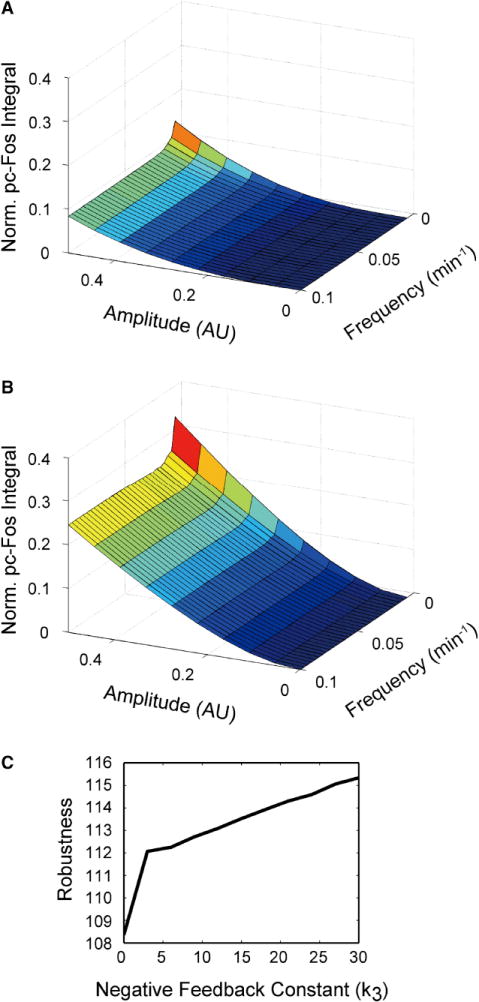
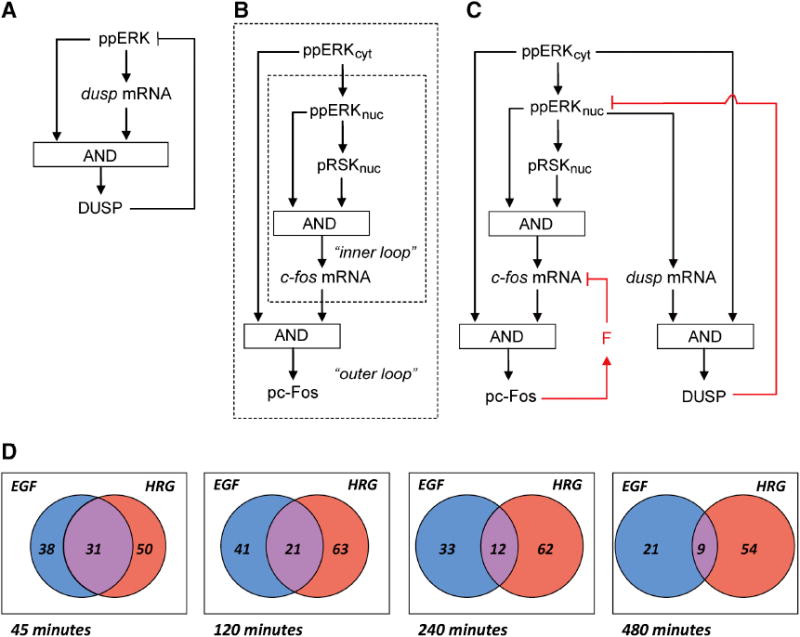
Activation of ErbB receptors by epidermal growth factor (EGF) or heregulin (HRG) determines distinct cell-fate decisions, although signals propagate through shared pathways. Using mathematical modeling and experimental approaches, we unravel how HRG and EGF generate distinct, all-or-none responses of the phosphorylated transcription factor c-Fos. In the cytosol, EGF induces transient and HRG induces sustained ERK activation. In the nucleus, however, ERK activity and c-fos mRNA expression are transient for both ligands. Knockdown of dual-specificity phosphatases extends HRG-stimulated nuclear ERK activation, but not c-fos mRNA expression, implying the existence of a HRG-induced repressor of c-fos transcription. Further experiments confirmed that this repressor is mainly induced by HRG, but not EGF, and requires new protein synthesis. We show how a spatially distributed, signaling-transcription cascade robustly discriminates between transient and sustained ERK activities at the c-Fos system level. The proposed control mechanisms are general and operate in different cell types, stimulated by various ligands.


Figures

Figure 1
Figure 1. The c-Fos expression network: responses to EGF and HRG and model’s schematic
MCF-7 cells were stimulated with 10 nM EGF or HRG for indicated periods of time (min), and the responses were measured with western blotting (proteins) or qRT-PCR (mRNA). Data were normalized by dividing them by the maximum value of the HRG-induced responses. Error bars denote standard error for at least three independent experiments; representative blot images can be found in the Fig. S1. (A) ppERK. (B) c-fos mRNA. (C) Total c-Fos. (D) T325 phosphorylated c-Fos. E. Model’s schematic. The nuclear membrane is shown by thick grey line, chemical transformations are depicted by solid lines, and nucleocytoplasmic transport is denoted by dashed lines. Rate laws and parameters for the individually numbered chemical reactions are given in Supp. Methods. Degraded protein and mRNA are represented by ϕ. Black lines correspond to mechanisms in the initial model, whereas orange lines denote model refinement that is based on additional experimental data (see Fig. 3). F-M. Points (blue diamonds - EGF and red squares - HRG) denote experimental data, solid lines denote simulations done with the initial model, and dashed lines represent these simulations ± standard deviation. F. Cytoplasmic MEK activation. G. Cytoplasmic ERK activation. H. Whole cell RSK phosphorylation. I. Whole cell CREB phosphorylation. J.dusp1 mRNA expression. K. c-fos mRNA expression. L. Whole cell c-Fos expression. M. Whole cell c-Fos phosphorylation. See also Fig. S1 and Tables S1-S4.
Figure 2
Figure 2. Sensitivities of c-fos mRNA duration and integrated pc-Fos responses to perturbations
Simulations are done with the initial model; ligand concentrations are 10 nM. A and B - Control coefficients for c-fos mRNA duration (A) and integrated pc-Fos (B) are shown by bars (blue, EGF and red, HRG). Numbers above bars indicate the reaction indices as shown in Fig. 1E, and error bars correspond to simulation standard deviation. Reactions are grouped according to biological processes (indicated above each plot) and not in the order of their numerical index. C and D - Simulated effects of various degrees of dusp knockdown on EGF- induced (C) and HRG-induced (D) c-fos mRNA expression. Downregulation of dusp is simulated by increasing the dusp mRNA degradation rate constant. See also Fig. S2.
Figure 3
Figure 3. Nuclear ERK activation dynamics and the effect of dusp downregulation on c-fos mRNA duration
A. Model predictions for nuclear ppERK time courses. Ligand concentrations are 10 nM (EGF, blue and HRG, red). B and C. Quantified nuclear ppERK dynamics based on cell images obtained from Duolink technology (EGF, blue and HRG, red; representative image is shown in Table S5A). Each data point is the average response based on ~180 individual cells in three independent experiments, and error bars correspond to standard error based on the three replicates. Solid lines denote in silico simulations, and dashed lines denote simulation standard deviation. For normalization, raw quantified data are divided by the 5 min. time point of each respective ligand dose. Shading corresponds to the nuclear ppERK profile between 15 and 60 min. D. Spatially-resolved ERK activation dynamics observed by immunofluorescence. Total ERK (green) is shown on the right and ppERK (red) is shown on the left. E,F,K,L. Measured vs. predicted effects of dusp downregulation on c-fos mRNA expression induced by 10 nM EGF (E and K) or HRG (F and L). Solid and dashed lines correspond to model simulations and their standard deviation, respectively. The dusp downregulation was modeled as an increase in the dusp mRNA degradation rate. Simulations in Panels E and F correspond to the initial model (Fig. 1E, black lines only) and simulations in Panels K and L correspond to the refined model (Fig. 1E, black and orange lines). G and H. c-fos mRNA expression in response to two 1 nM pulses of (G) EGF or (H) HRG. Arrows denote the second stimulation time. I and J. Effects of cycloheximide on c-fos mRNA expression induced by 10 nM EGF (I) or 10 nM HRG (J). For Panels E-L, error bars denote the standard error from three independent experiments. Note that Panels I and J have different y-axis scales. In Panels E, F, and I-L, data values are relative to their respective 30 min. HRG control point. Solid and dashed lines correspond to model simulations and their standard deviation, respectively. Simulations done with the refined model are indicated. See also Table S5.
Figure 4
Figure 4. Core c-Fos expression model
A. Model schematic. B-D The core model parameters were trained by the responses of ppERK, c-fos mRNA, and pc-Fos to 10 nM EGF or 10 nM HRG in MCF-7 cells. E-H. To validate the model, we compared model predictions to the observed pc-Fos responses for different EGF and HRG doses (1 nM and 0.1 nM) in MCF-7 cells. Experimental data were obtained with western blotting (proteins) or qRT-PCR (mRNA). Error bars denote standard error for at least three independent experiments, and representative western blot images can be found in Fig. S3. For all time course plots, solid lines denote simulations. See also Fig. S3.
Figure 5
Figure 5. Robustness of the c-Fos expression network
A and B. Robustness to disturbances in ppERK increases when the inner CFL is present (A) and decreases when this CFL is absent (B). Disturbances are simulated as |A sin(ωt)|, where A is the amplitude, ω is the frequency and t is time. AU stands for Arbitrary Units. These arbitrary units correspond to the same arbitrary units characterizing cytoplasmic ppERK measurements in Figs. 1G, 4B, and 4E. The inner CFL is “absent” when the dependence of c-fos transcription on pRSK is disregarded in the model. The integrated pc-Fos response is expressed in the units relative to the 10 nM HRG response. C. Robustness of the c-Fos expression system increases with increasing the integral negative feedback strength (k3). Robustness is quantified as the sum over all inverse, absolute control coefficients of system parameters (the greater this sum is the smaller the changes that occur when parameters are perturbed, see Methods).
Figure 6
Figure 6. ERK activation is an ubiquitous master regulator of the integrated pc-Fos responses
(A-C) PC-12 cells were stimulated with 10 nM EGF or 10 nM NGF for indicated periods of time and responses were measured with western blotting (proteins) or qRT-PCR (mRNA). Data were normalized by dividing them by the maximum value of the HRG-induced responses. (D-E) MCF-7 cells were stimulated with 10 nM EGF + 100 nM PMA. F. The ppERK input is characterized by three parameters: the peak amplitude Ap, the peak time Tp and the decay time τ. G. Quantitative relationship between the integrated pc-Fos output and the ppERK decay time τ. Data points correspond to experimental data for various ligand doses in MCF-7 and PC-12 cells, which are indicated by text boxes. The ppERK decay time τ was calculated from experimental data (see Supp. Methods, Core Model Description, τind). For simulations, the values for Ap and Tp were fixed at 1 and 10 min., respectively, as is commonly observed for ppERK responses. Calculation of the integrated pc-Fos responses from experimental data is described in Supp. Methods. For all relevant panels, error bars denote standard error for at least three independent experiments, representative blot images can be found in Fig. S4, and solid lines denote simulations. For all panels, simulations were done using the core model. See also Fig. S4.
Figure 7
Figure 7. Regulatory motifs in the c-Fos expression network and emerging differential, long-term transcription factor expression
A. DUSP negative feedback superimposed onto the CFL. B. The CFL cascade structure of c-Fos regulation wherein the fast, nuclear inner CFL is contained within the slow, cytoplasmic outer CFL. C. The overall network structure which includes the cascade CFL embedded into the transcriptional negative feedback loops. D. Venn diagrams showing the number of common differentially expressed TFs between the EGF and HRG responses. The EGF (left - blue) and HRG (right - red) sets correspond to the number of differentially expressed gene probes that were identified as transcription factors by query to the gene ontology database. See also Fig. S5.

References

    1. Armstrong SP, Caunt CJ, McArdle CA. Gonadotropin-Releasing Hormone and Protein Kinase C Signaling to ERK: Spatiotemporal Regulation of ERK by Docking Domains and Dual-Specificity Phosphatases. Mol Endocrinol. 2009;23:510–519. - PMC - PubMed
    1. Birtwistle MR, Hatakeyama M, Yumoto N, Ogunnaike BA, Hoek JB, Kholodenko BN. Ligand-dependent responses of the ErbB signaling network: experimental and modeling analyses. Mol Syst Biol. 2007;3:144. - PMC - PubMed
    1. Brondello JM, Brunet A, Pouyssegur J, McKenzie FR. The dual specificity mitogen-activated protein kinase phosphatase-1 and -2 are induced by the p42/p44MAPK cascade. J Biol Chem. 1997;272:1368–1376. - PubMed
    1. Brondello JM, McKenzie FR, Sun H, Tonks NK, Pouyssegur J. Constitutive MAP kinase phosphatase (MKP-1) expression blocks G1 specific gene transcription and S-phase entry in fibroblasts. Oncogene. 1995;10:1895–1904. - PubMed
    1. Brondello JM, Pouyssegur J, McKenzie FR. Reduced MAP kinase phosphatase-1 degradation after p42/p44MAPK-dependent phosphorylation. Science. 1999;286:2514–2517. - PubMed

Publication types

MeSH terms