. 2010 Jun 8;20(11):969-78.
doi: 10.1016/j.cub.2010.04.039. Epub 2010 May 20.

The leucokinin pathway and its neurons regulate meal size in Drosophila

Affiliations

The leucokinin pathway and its neurons regulate meal size in Drosophila

Bader Al-Anzi et al. Curr Biol. .

Abstract

Background: Total food intake is a function of meal size and meal frequency, and adjustments to these parameters allow animals to maintain a stable energy balance in changing environmental conditions. The physiological mechanisms that regulate meal size have been studied in blowflies but have not been previously examined in Drosophila.

Results: Here we show that mutations in the leucokinin neuropeptide (leuc) and leucokinin receptor (lkr) genes cause phenotypes in which Drosophila adults have an increase in meal size and a compensatory reduction in meal frequency. Because mutant flies take larger but fewer meals, their caloric intake is the same as that of wild-type flies. The expression patterns of the leuc and lkr genes identify small groups of brain neurons that regulate this behavior. Leuc-containing presynaptic terminals are found close to Lkr neurons in the brain and ventral ganglia, suggesting that they deliver Leuc peptide to these neurons. Lkr neurons innervate the foregut. Flies in which Leuc or Lkr neurons are ablated have defects identical to those of leucokinin pathway mutants.

Conclusions: Our data suggest that the increase in meal size in leuc and lkr mutants is due to a meal termination defect, perhaps arising from impaired communication of gut distension signals to the brain. Leucokinin and the leucokinin receptor are homologous to vertebrate tachykinin and its receptor, and injection of tachykinins reduces food consumption. Our results suggest that the roles of the tachykinin system in regulating food intake might be evolutionarily conserved between insects and vertebrates.


Figures

Figure 1
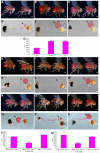
Figure 1. Mutation of leuc or lkr causes increases in post-starvation food intake
Wild-type flies have a normally sized abdomen (A, asterisk) and crop (D, arrow) when subjected to the two-dye feeding assay after starvation. The crop of unstarved flies would be of a similar size. leucc275 mutants have bloated abdomens (B, asterisk) with enlarged crops (E, arrow) when subjected to the same assay. The same result is observed in lkrc003 mutant flies (C, asterisk, and F, arrow, respectively). (G) When leucc275 or lkrc003 flies are fed 14C-labelled-leucine food in the two-dye feeding assay after starvation, an increase in food intake is observed as compared to wild-type. In leucc275 mutants, panneuronal expression of UAS-leuc using the Elav-GAL4 driver rescues the abdominal and crop bloating phenotypes as shown by the two-dye assay (I, asterisk, and L, arrow, respectively), and the abnormal increase in post-starvation food intake (T). No rescue is observed in control leucc275 flies that carry the Elav-GAL4 driver alone (H, K, T) or only the UAS-leuc transgene (J, M, T). Pan-neuronal expression of UAS-lkr also rescues the phenotypes of lkrc003 (O, R, U). No rescue is observed in control mutant lkrc003 flies that carry the Elav-GAL4 driver alone (N, Q, U) or only the UAS-lkr transgene (P, S, U). White scale bar: 200 μm. Error bars are standard deviations of five different replicates for a given genotype. (Asterisks denote T-test statistical significance: *; P<0.05, **; P<0.01, ***; P<0.005, ****; P<0.0005).
Figure 2
Figure 2. leuc and lkr mutants have an increase in meal size that is associated with a reduction in meal frequency
(A) leucc275 and lkrc003 do not exhibit an increase in intake of radioactivity relative to wild-type when exposed to 14C-labelled-leucine food for 48 hours without starvation. When the café feeding assay is performed on single non-starving flies, leucc275 and lkrc003 flies have a decrease in 0.1-0.2μl meals that is associated with an increase in meals that are larger than 0.4μl. This increase in meal size is associated with a reduction in recorded meal events as compared to wild-type flies (B, and C, respectively). However, both mutants still have an overall food intake that is similar to wild-type (D). Pan-neuronal expression of UAS-leuc rescues the meal size and frequency defects of leucc273 flies in the single fly café assay (E and F, respectively). No rescue of either feeding parameter is observed in control mutant leucc273 flies that carry the Elav-Gal4 driver alone or only the UAS-leuc transgene (E and F, respectively). Pan-neuronal expression of UAS-lkr rescues the meal size and frequency defects of lkrc003 in the single fly café assay (H and I, respectively). No rescue of either feeding parameter is observed in control mutant lkrc003 flies that carry the Elav-Gal4 driver alone or only the UAS-lkr transgene (H, and I, respectively). No difference in total food intake is observed between the different genotypes (G and J). (K) The post-starvation increase in food intake in leucc275 and lkrc003 is later compensated for by a reduction in food intake that ultimately causes them to have similar overall food intake as wild-type flies by ~60 hr. Error bars are standard deviations for 5-8 different replicates for a given genotype in A and K, and for 20-25 single fly analyses in B-J. Asterisks denote T-test statistical significance: *; P<0.05, **; P<0.01, ***; P<0.005, ****; P<0.0005.
Figure 3
Figure 3. Expression patterns of Leucokinin and Lkr in the brain and ventral ganglia
Western blotting using antibodies against leucokinin (anti-Leuc) or Lkr (anti-Lkr) demonstrates a reduction in the level of expression of leucokinin in leucc275 mutants (A) and of Lkr in lkrc003 mutants (B) as compared to wild-type. Antibody against tubulin (anti-tub) was used as a tissue extract loading control; these lanes show that the mutant extracts contain the same amount of protein. In Leuc-Gal4::UAS-mCD8-GFP flies, anti-Leuc (C and F, red; D and E, green) and anti-GFP (C and F, green) signals co-localize in neuronal soma in the lateral horn and the SOG (C, yellow arrows). Asterisks in (C) indicate neuropilar regions that label brightly with anti-Leuc. (D) A higher magnification view of one of the lateral horn Leuc neurons, LHLK, showing the cell body (red arrow) and puncta along neuronal processes (yellow arrow). (E) A similar view of two of the SOG neurons, the SELKs. (F) The ventral ganglia, showing two rows of Leuc neurons (ABLKs). Some of these (yellow, indicated by yellow arrow) express more GFP than others (red, indicated by red arrow. (G) A higher magnification view of the ABLKs. A cell body is labeled by a red arrow, while the line of axons and synapses along the midline are indicated by a yellow arrow. (H-I) Leuc-GAL4::n-syb-GFP brain (H) and ventral ganglia (I) stained with anti-Leuc (red) and anti-GFP (green), showing co-localization in cell bodies (red arrows) and presynaptic terminals (yellow arrows). The ABLK cell bodies in (I) have much less n-syb than the terminals. In Lkr-GAL4::UAS-mCD8::GFP flies, anti-Lkr (J and L, red) and anti-GFP signals (J-L, green) co-localize in dorsally located neuronal cell bodies, and also in the axons of the fan-shaped body in the central complex (F, arrows). We also observe expression in two large neurons in the ventral ganglia (L, arrow). (K) A higher magnification view of the brain Lkr neurons in one hemisphere. Red arrow, cell body; yellow arrow, fan-shaped body. (M-O) Brain/ventral ganglia in Lkr-GAL4::UAS-mCD8::GFP animals, stained with anti-Leuc and anti-GFP. (M) An LHLK neuron (red arrow) has neuronal processes with synaptic boutons (chains of red dots) that are close to green-stained Lkr-GAL4::UAS-mCD8::GFP neurons (yellow arrows). (N) Leuc-positive boutons are near axons (faint green lines) of Lkr-GAL4::UAS-mCD8::GFP neurons in the ventral ganglion. (O) A single confocal slice of approximately 0.3 μm in depth shows Leuc-positive synaptic terminals (red) in the lateral horn adjacent to or contacting processes of Lkr-GAL4::UAS-mCD8::GFP neurons (green). Note the paired red dots adjacent to a green profile (left arrow), and a red dot between two green dots (middle arrow. White scale bar: 200 μm.
Figure 4
Figure 4. Lkr expression in the foregut
(A) In a sagittal cryostat section of Leuc-GAL4::UAS-mCD8-GFP flies, no expression of either GFP or Leuc is observed in the foregut region (asterisk, gut lumen; arrow, proventricular region). (B) In a sagittal cryostat section of Lkr-GAL4::UAS-mCD8-GFP flies, GFP and Lkr are observed in the foregut (B and B inset, red arrows and green asterisks). Note the GFP-positive axons that run along the dorsal side of the foregut, and may connect it with the brain (B inset, yellow arrows). (C) A dissected foregut section (anterior to the left) from Lkr-GAL4::UAS-mCD8-GFP flies, triple-stained with anti-Lkr (red), anti-GFP (green), and anti-Elav, which labels neuronal nuclei (blue). Green staining overlaps with red staining in the proventricular area (yellow arrow). Note that some of the Elav-positive neurons appear to also express Lkr and GFP (red arrows). Triple-stained foregut section (inset) also shows colocalization of Lkr and GFP on axons (yellow arrows). White scale bar: 200 μm.
Figure 5
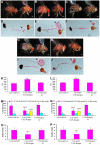
Figure 5. Ablation of Leuc-Gal4 and Lkr-Gal4 expressing neurons produces meal size and frequency defects that match those seen in leucc275 and lkrc003 mutants
Leuc-GAL4::UAS-reaper (B, E, K) and Lkr-GAL4::UAS-reaper (G, I, L) flies have bloated abdomens (asterisks) and overfilled crops (arrows), when subjected to the two-dye feeding assay after starvation. (K-L) They also exhibit an increase in 14C -leucine food intake. Leuc-GAL4::UAS-reaper (M) and Lkr-GAL4::UAS-reaper (N) flies exhibit decreases in 0.1-0.2μl meals that are associated with increases in meals that are larger than 0.4 μl when examined by the single fly café feeding assay. This increase in meal size is associated with a reduction in the number of meals taken (O and P, respectively). Control UAS-reaper/+ (A, D), Leuc-GAL4/+ (C, F), and Lkr-GAL4/+ (H, J) flies do not show any of the above defects in feeding behavior when examined by the same assays. White scale bar: 200 μm. Error bars are standard deviation of five different replicates for a given genotype in K and L, and of 20-25 single fly analyses in M-P. Asterisks denote T-test statistical significance: *; P<0.05, **; P<0.01, ***; P<0.005, ****; P<0.0005.

References

    1. Murphy K, Bloom S. Gut hormones and the regulation of energy homeostasis. Nature. 2006;444(7121):854–9. - PubMed
    1. Woods SC, D’Alessio DA. Central control of body weight and appetite. J Clin Endocrinol Metab. 2008;93(11 Suppl 1):S37–50. - PMC - PubMed
    1. Phillips R, Powley T. Gastric volume rather than nutrient content inhibits food intake. Am. J. Physiol. 1996;271:R766–779. - PubMed
    1. Smith G. The direct and indirect controls of meal size. Neurosci Biobehav Rev. 1996;20:41–46. - PubMed
    1. Smith G. The controls of eating: a shift from nutritional homeostasis to behavioral neuroscience. Nutrition. 2000;16:814–820. - PubMed

Publication types

MeSH terms