. 2010 May 18;18(5):763-74.
doi: 10.1016/j.devcel.2010.02.018.

S6K1 plays a critical role in early adipocyte differentiation

Affiliations

S6K1 plays a critical role in early adipocyte differentiation

Larissa S Carnevalli et al. Dev Cell. .

Abstract

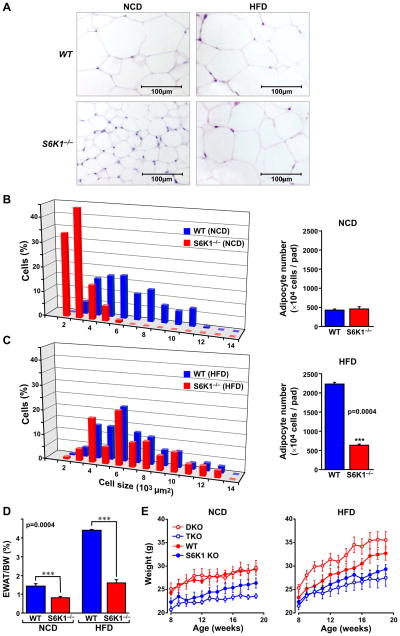
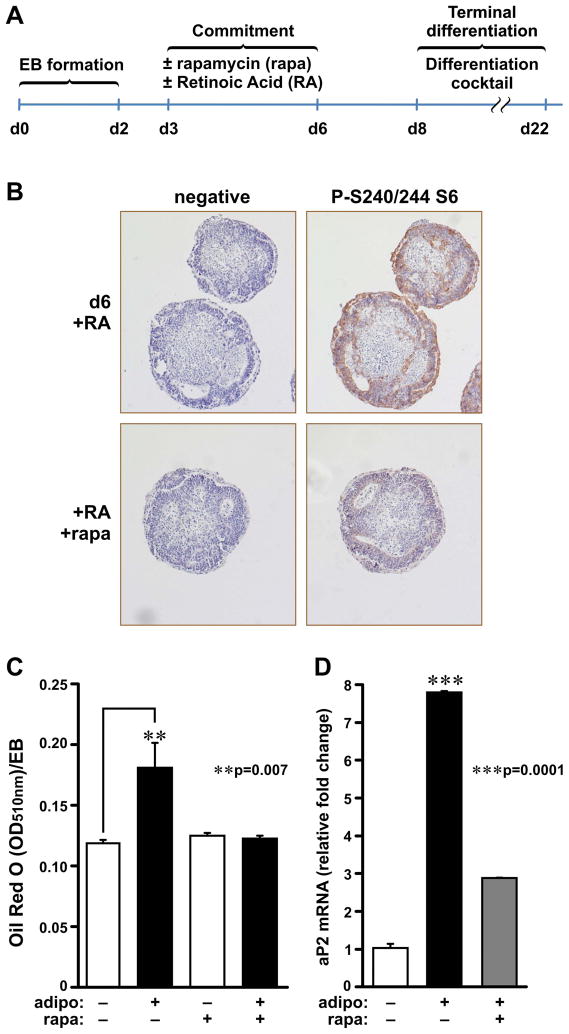
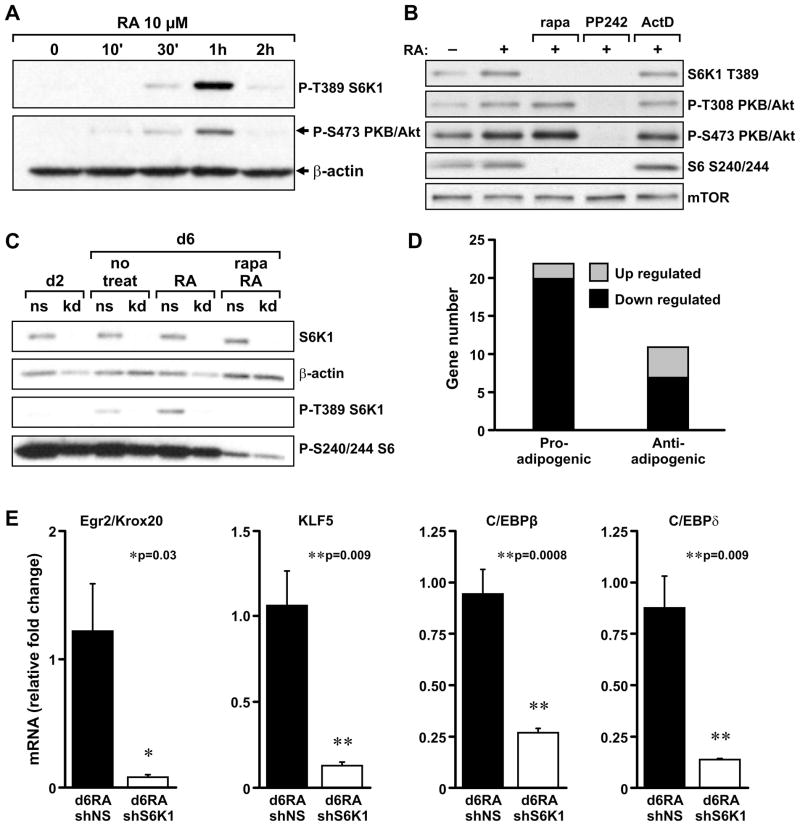
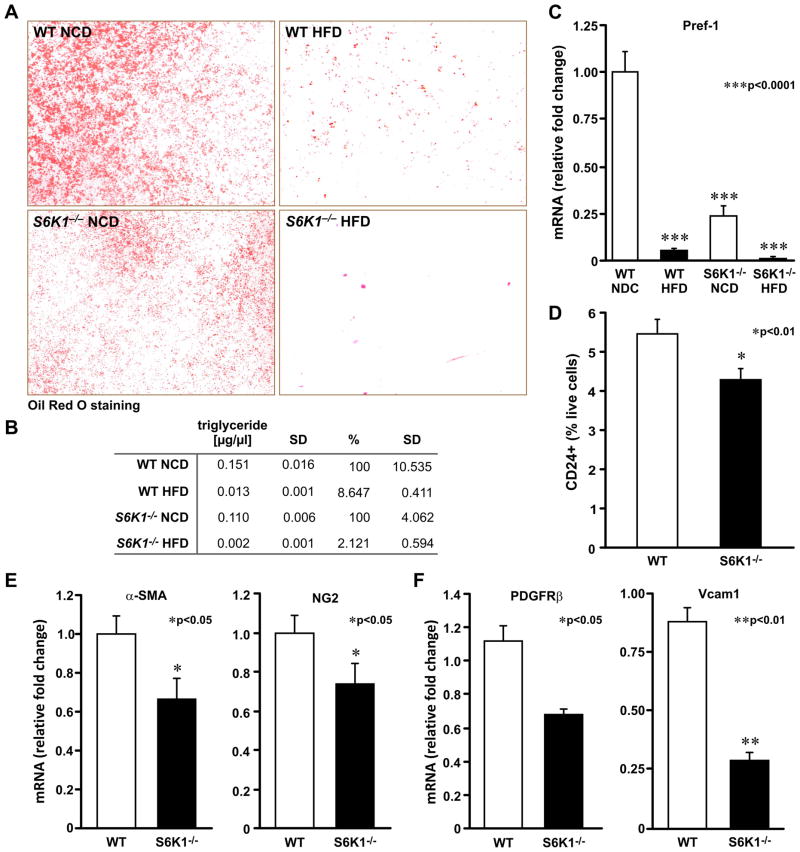
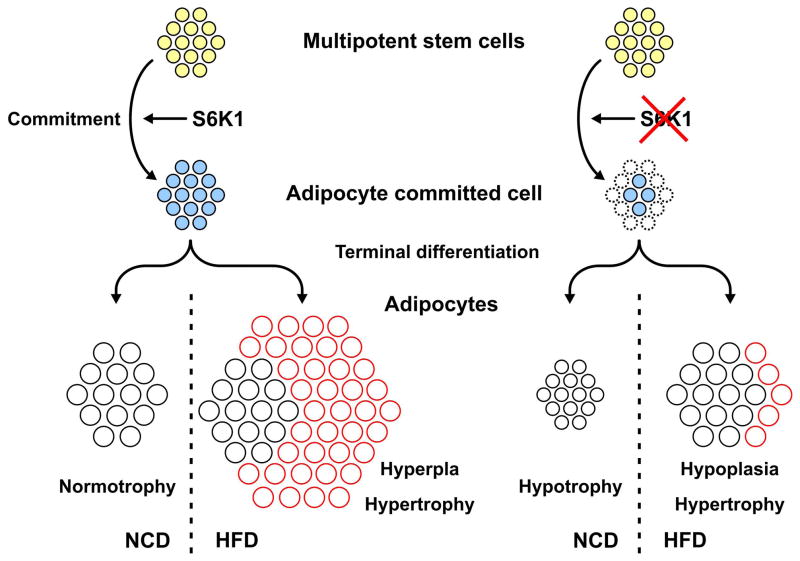
Earlier, we reported that S6K1(-/-) mice have reduced body fat mass, have elevated rates of lipolysis, have severely decreased adipocyte size, and are resistant to high fat diet (HFD)-induced obesity. Here we report that adipocytes of S6K1(-/-) mice on a HFD have the capacity to increase in size to a degree comparable to that of wild-type (WT) mice, but not in number, indicating an unexpected lesion in adipogenesis. Tracing this lesion revealed that S6K1 is dispensable for terminal adipocyte differentiation, but is involved in the commitment of embryonic stem cells to early adipocyte progenitors. We further show that absence of S6K1 attenuates the upregulation of transcription factors critical for commitment to adipogenesis. These results led to the conclusion that a lack of S6K1 impairs the generation of de novo adipocytes when mice are challenged with a HFD, consistent with a reduction in early adipocyte progenitors.


Figures

Figure 1
Figure 1. Adipose tissue of S6K1−/− mice on a HFD shows adipocyte hypertrophy but not hyperplasia
(A) Histological analysis of adipose tissue sections of S6K1−/− and WT mice fed on a NCD or HFD. (B) Morphometric analysis of adipocyte cell size from NCD epididymal white adipose tissue (EWAT) based on a total of 200 cells (left), and total cell number of adipocytes per fat pad (right) from WT and S6K1−/− mice (n=3 for each genotype). (C) Morphometric analysis of adipocyte cell size from HFD EWAT based on a total of 200 cells (left) and total cell number of adipocytes per fat pad (right) in WT and S6K1−/− mice (n=3 for each genotype). (D) EWAT total mass was measured from WT or S6K1−/− mice maintained on a NCD or HFD. Values were normalized on the basis of total body weight. (E) Body weight analysis of S6K1−/− (S6K1), 4E-BP1/2−/− (DKO), and S6K1−/−/4EBP1/2−/− triple knockouts (TKO) maintained on a NCD (left) or HFD (right) for 6 weeks (n=6 for each genotype). p values are listed in Supplemental Data, Table S1.
Figure 2
Figure 2. Reduced adipogenesis in S6K1−/− MEFs and ADSCs
(A–B) Oil Red O staining of adipocytes derived from S6K1−/− MEFs that are (A) non-infected (-LV), infected with lentivirus overexpressing GFP (LV-GFP), or with lentivirus overexpressing S6K1 (LV-S6K1); or (B) from ADSCs of WT or S6K1−/− mouse adipose tissue. (C–D) Quantification of Oil Red O-stained adipocytes derived from either (C) differentiated MEFs or (D) WT and S6K1−/− ADSCs. (E) S6K1 was ectopically re-expressed in S6K1−/− MEFs by infection with a lentivirus carrying S6K1 cDNA (LV-S6K1). Total S6K1, T389 S6K1 phosphorylation (P-T389 S6K1), and β-actin levels were determined by western blot analysis. (F) S6K1 was depleted in WT ADSCs by infection with lentiviruses carrying either non-silencing shRNAs (shNS) or S6K1-specific shRNAs (shS6K1). Cells were differentiated into adipocytes (day 9) and analyzed by western blot to determine expression levels of total S6K1, S240/S244 S6 phosphorylation (P-S240/244 S6), aP2, and β-actin. (G) Terminal adipocyte differentiation of WT and S6K1−/− ADSCs was assessed by quantification of Oil Red O staining. Values in C, D, and G are given as mean ± SEM. (ns, not statistically significant). See also Figure S1.
Figure 3
Figure 3. Rapamycin and S6K1 depletion affect determination step of EB-to-adipocyte differentiation
(A) Schematic representation of the differentiation of WT ESCs into adipocytes upon rapamycin treatment. EB formation (d0-d2), EBs in suspension under RA treatment (d3-d6), adaptation to culture on gelatin-coated plates (d6-8), and terminal differentiation of EBs into adipocytes induced by adipogenic cocktail (d6-d22). (B) H&E staining (left) and P-S240/244 S6 IHC with hematoxylin counterstain of RA-treated EBs with or without rapamycin (rapa). (C) Quantification of differentiated adipocytes derived from WT EBs (d22) with or without 20 nM rapamycin (rapa) treatment in the presence of 1 μM RA (d3-d6) with or without adipogenic differentiation inducers (d8-d22) (adipo). Oil Red O-stained lipids were extracted, the absorbance at 510 nm (OD510) was measured, and the value was normalized for EB number and size. (D) Adipocyte marker aP2 mRNA levels were analyzed by qPCR and normalized to 18S rRNA. Values in C and D are given as mean ± SEM.
Figure 4
Figure 4. S6K1 is required for commitment of ESCs to the adipocyte lineage
(A) ESCs were infected with lentivirus carrying shNS or shS6K1 and stable cell lines were generated. Levels of S6K1 and β-actin protein were determined by western blot analysis. (B) Size measurements of EBs (d2) derived from shNS and shS6K1 lentivirus-infected ESC lines as obtained by seeding either 2×10³ or 5×10³ cells in suspension; micrograph of d2 EBs (right panel). (C) Cell numbers during EB formation by shNS and shS6K1 ESC lines at 0hrs (d0), 24hrs (d1), and 48hrs (d2). (D) Oil Red O staining of differentiated adipocytes derived from shNS and shS6K1 EBs. (E) Adipocyte differentiation was assessed by spectrophotometric detection at 510 nm (OD510) of Oil Red O in extracts from EBs infected with shNS- or shS6K1-containing lentiviruses. Values were normalized to EB size and number. (F) S6K1 was ectopically re-expressed in shS6K1 ESCs (shS6K1+LVS6K1) and cell number was determined during EB formation at the 24hr time point. (G) Adipocyte differentiation assessed, as in E, by measuring Oil Red O stain in cell extracts, and normalized according to EB size and number. Values in B, C, E, F, and G are given as mean ± SEM. See also Figure S2.
Figure 5
Figure 5. Retinoic Acid (RA) treatment activates S6K1 phosphorylation in ESCs and EBs
(A) Left panel: ESCs were treated with 10μM RA for 2 hours. S6K1 T389 and PKB/Akt S473 phosphorylation were measured by western blot analysis and β-actin was used as a protein-loading control. (B) ESCs were pre-treated for 15min with 20nM Rapamycin (rapa), 8μM PP242, or 5μg/ml Actinomycin D (ActD), and then stimulated with 10μM RA for an additional 45 min. Levels of P-T389 S6K1, P-S473 PKB/Akt, P-T308 PKB/Akt, and P-S240/244 S6 were detected by western blot analysis. mTOR was used as protein-loading control. (C) EBs formed from the shNS ESC line (ns) or shS6K1ESC line (kd) were treated with 1μM RA for 3 days (d3-d6). Total S6K1, P-T389 S6K1, and P-S240/244 S6 were determined by western blot analysis in d6 EBs, with β-actin used as a protein-loading control. (D) Number of adipogenesis-related genes upregulated or downregulated in microarray analyses of RA-treated shNS and shS6K1 EBs (see Experimental Procedures). (E) Expression levels of early adipogenic marker genes, Krox20/Egr2, KLF5, C/EBPβ, and C/EBPδ. Total RNA was prepared from RA-treated shNS EBs (d6RA shNS) or shS6K1 EBs (d6RA shS6K1) and analyzed by qPCR. The expression values were normalized to 18s rRNA levels. Values in D are given as mean ± SEM. See also Table S2.
Figure 6
Figure 6. S6K1 is required for the generation and differentiation of adipocyte precursor cells in adipose tissue of mice exposed to a high-fat diet
(A) Oil Red O staining of differentiated adipocytes from WT or S6K1−/− ADSC cells derived from adipose tissue of 6-month-old mice maintained either on a NCD or a HFD (n=3 mice of each genotype). (B) Quantification of total triglyceride content from differentiated cells, normalized to total DNA content. Values in B are given as mean ± SD. (C) Expression levels of Pref-1 marker in ADSCs. (D) Sorting of Lin/CD29+/Sca1+/CD34+/CD24+ cells (CD24+) from SVFs of WT and S6K1−/− mice. (E) Expression levels of pericyte markers α-Sma and NG2 in total fat depots. (F) Expression levels of PDGFRβ and Vcam1 in SVFs. (E–F) Data obtained by qPCR measurements and normalized to 18S rRNA levels (Values given in mean ± SEM). See also figure S3.
Figure 7
Figure 7
Model depicting the effect of S6K1 loss on adipogenesis in mice maintained on a NCD or when challenged with a HFD (see text for details).

References

    1. Aguilar V, Alliouachene S, Sotiropoulos A, Sobering A, Athea Y, Djouadi F, Miraux S, Thiaudiere E, Foretz M, Viollet B, et al. S6 Kinase Deletion Suppresses Muscle Growth Adaptations to Nutrient Availability by Activating AMP Kinase. Cell Metab. 2007;5:476–487. - PubMed
    1. Banko JL, Poulin F, Hou L, DeMaria CT, Sonenberg N, Klann E. The translation repressor 4E-BP2 is critical for eIF4F complex formation, synaptic plasticity, and memory in the hippocampus. J Neurosci. 2005;25:9581–9590. - PMC - PubMed
    1. Biondi RM, Kieloch A, Currie RA, Deak M, Alessi DR. The PIF-binding pocket in PDK1 is essential for activation of S6K and SGK, but not PKB. Embo J. 2001;20:4380–4390. - PMC - PubMed
    1. Birsoy K, Chen Z, Friedman J. Transcriptional regulation of adipogenesis by KLF4. Cell Metab. 2008;7:339–347. - PMC - PubMed
    1. Bone HK, Welham MJ. Phosphoinositide 3-kinase signalling regulates early development and developmental haemopoiesis. Journal of cell science. 2007;120:1752–1762. - PMC - PubMed

Publication types

Substances

Associated data