. 2010 Jul 23;400(4):724-42.
doi: 10.1016/j.jmb.2010.05.027. Epub 2010 May 21.

SARS coronavirus unique domain: three-domain molecular architecture in solution and RNA binding

Affiliations

SARS coronavirus unique domain: three-domain molecular architecture in solution and RNA binding

Margaret A Johnson et al. J Mol Biol. .

Abstract

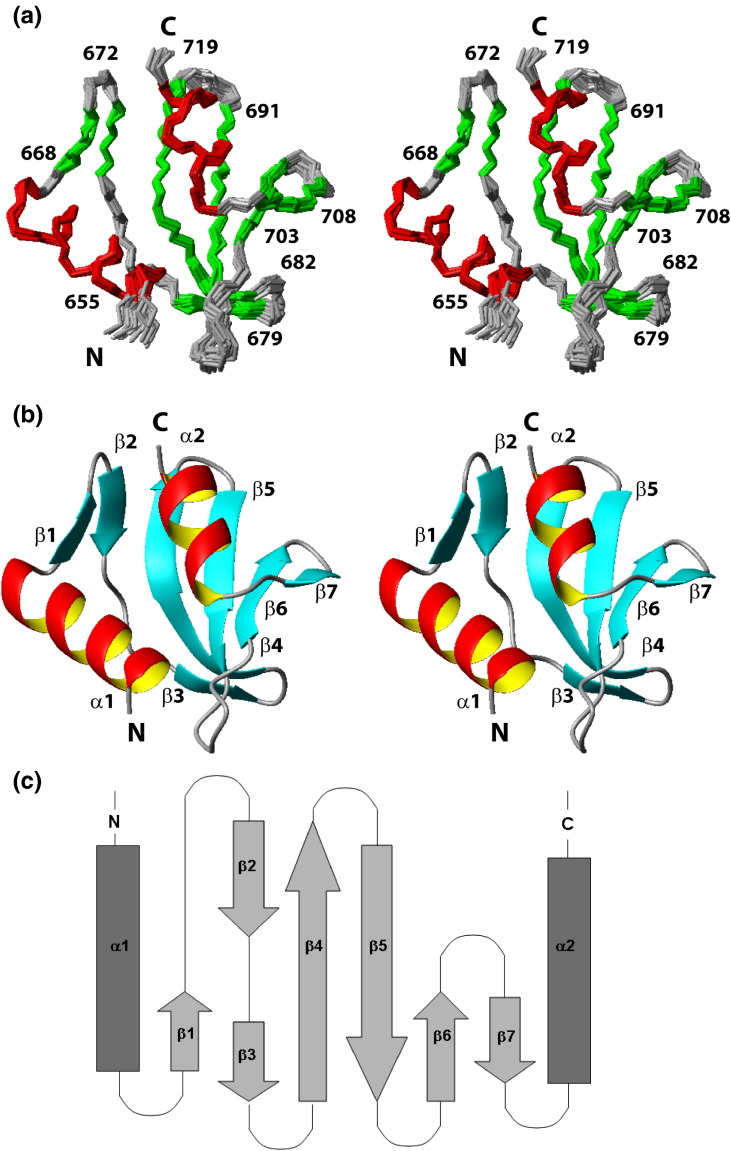
Nonstructural protein 3 of the severe acute respiratory syndrome (SARS) coronavirus includes a "SARS-unique domain" (SUD) consisting of three globular domains separated by short linker peptide segments. This work reports NMR structure determinations of the C-terminal domain (SUD-C) and a two-domain construct (SUD-MC) containing the middle domain (SUD-M) and the C-terminal domain, and NMR data on the conformational states of the N-terminal domain (SUD-N) and the SUD-NM two-domain construct. Both SUD-N and SUD-NM are monomeric and globular in solution; in SUD-NM, there is high mobility in the two-residue interdomain linking sequence, with no preferred relative orientation of the two domains. SUD-C adopts a frataxin like fold and has structural similarity to DNA-binding domains of DNA-modifying enzymes. The structures of both SUD-M (previously determined) and SUD-C (from the present study) are maintained in SUD-MC, where the two domains are flexibly linked. Gel-shift experiments showed that both SUD-C and SUD-MC bind to single-stranded RNA and recognize purine bases more strongly than pyrimidine bases, whereby SUD-MC binds to a more restricted set of purine-containing RNA sequences than SUD-M. NMR chemical shift perturbation experiments with observations of (15)N-labeled proteins further resulted in delineation of RNA binding sites (i.e., in SUD-M, a positively charged surface area with a pronounced cavity, and in SUD-C, several residues of an anti-parallel beta-sheet). Overall, the present data provide evidence for molecular mechanisms involving the concerted actions of SUD-M and SUD-C, which result in specific RNA binding that might be unique to the SUD and, thus, to the SARS coronavirus.


Figures

Fig. 1
Fig. 1
NMR solution structure of SUD-C. (a) Bundle of 20 energy-minimized NMR conformers representing the solution structure of SUD-C, superimposed for minimal RMSD of the N, Cα, and C′ atoms of residues 655–720. Residues in α-helices are shown in red, those in β-strands are shown in green, and regions without regular secondary structure are shown in gray. Selected sequence positions are indicated by numerals. (b) Ribbon presentation of the conformer with the lowest RMSD to the mean coordinates of the ensemble shown in (a). Regular secondary structures are identified. (c) Topology diagram of SUD-C, where α-helices are represented by rectangles and β-strands are represented by arrows. Dark gray, the plane closest to the viewer on which the α-helices lie; light gray, the plane farthest from the viewer on which the β-strands lie.
Fig. 2
Fig. 2
NMR solution structure of SUD-MC. (a) Bundle of 20 energy-minimized NMR conformers superimposed for minimal RMSD of the backbone N, Cα, and C′ atoms of SUD-M (residues 527–648). In SUD-M, residues in α-helices are shown in red, those in β-strands are shown in green, and regions without regular secondary structure are shown in gray. SUD-C is shown in gray. The N-terminus of SUD-M is labeled, and the backbone of the C-terminal residue of SUD-C is shown in blue. (b) The same bundle of conformers as in (a) superimposed for minimal RMSD of the backbone N, Cα, and C′ atoms of SUD-C (residues 655–720). In SUD-C, residues in α-helices are shown in red, those in β-strands are shown in green, and regions without regular secondary structure are shown in gray. SUD-M is shown in gray. The C-terminus of SUD-C is labeled, and the backbone of the N-terminal residue of SUD-M is shown in blue. (c) 15N{1H} NOE values (Irel) plotted versus the sequence of SUD-MC. The sequence positions of regular secondary structures are indicated at the top of the panel.
Fig. 3
Fig. 3
(a) Stereo view of the bundle of 20 energy-minimized NMR conformers calculated from data collected with the isolated SUD-M (brown), superimposed for minimal RMSD of the N, Cα, and C′ atoms of residues 527–648. This bundle has been superimposed with the NMR structure of SUD-M calculated from data collected with SUD-MC, which is represented by the conformer that has the minimal RMSD to the mean coordinates of the bundle of 20 conformers in Fig. 2a (black). (b) Stereo view of the bundle of 20 energy-minimized NMR conformers calculated from data collected with the isolated SUD-C (cyan), superimposed for minimal RMSD of the N, Cα, and C′ atoms of residues 655–720. This bundle has been superimposed with the NMR structure of SUD-C calculated from data collected with SUD-MC, which is represented by a single conformer as described in (a) (black). (c and d) Chemical shift deviations from random-coil values in SUD-M and SUD-C, respectively. Values of Δδ(13Cα) and Δδ(13Cβ) were determined with the program UNIO by subtracting random-coil chemical shifts from experimentally observed chemical shifts. The Δδi value for each residue is an average value over three consecutive residues − 1, i, and + 1, given by Δδi = (Δδ(13Cα)i  1 + Δδ(13Cα)i + Δδ(13Cα)i + 1 − Δδ(13Cβ)i  1 − Δδ(13Cβ)i − Δδ(13Cβ)i + 1)/3. Residues in helices typically have positive Δδi values, while those in β-strands have negative values. The Δδi values for the isolated domains are plotted in black, where the data for the isolated SUD-M were taken from Chatterjee et al., and those in the intact SUD-MC construct are shown in red. Above the plots, the locations of regular secondary structures, as determined by PROCHECK, are shown by rectangles (helices) and arrows (β-strands).
Fig. 4
Fig. 4
Comparison of the NMR correlation spectra of SUD-NM, SUD-N, and SUD-M. (a) Overlay of the 2D 15N,1H HSQC spectra of SUD-NM (red) and SUD-N (blue). (b) Expanded presentation of the spectral region indicated by the box in (a). (c) Overlay of the 2D 15N,1H HSQC spectra of SUD-NM (red) and SUD-M (blue). (d) Expanded presentation of the spectral region indicated by the box in (c). In (b) and (d), the asterisk indicates a peak that was, by exclusion, tentatively assigned to the interdomain linker peptide segment between SUD-N and SUD-M in SUD-NM (see the text).
Fig. 5
Fig. 5
Size-exclusion chromatograms from a Superdex 75 26/60 column. (a) SUD-N. (b) SUD-NM. The broken lines indicate the elution volumes of protein standards (13.7 kDa, ribonuclease A; 29.0 kDa, carbonic anhydrase; 43.0 kDa, ovalbumin). The numbers near the top of the elution peaks indicate the apparent molecular masses calculated from the observed elution volumes, and the numbers in parentheses indicate the actual molecular masses of the proteins. Protein elution was monitored by the absorbance at 280 nm (A280).
Fig. 6
Fig. 6
Gel-shift (EMSA) assays probing the interactions of the proteins with ssRNA. (a) SUD-MC with A10, C10, U10, and (GGGA)5. (b) SUD-MC with TRS(+), TRS(−), GAUA, and (GGGA)5 (see the text for the notation used). The protein concentrations are indicated above the gels.  RNA (30 μM) is present in all, except for the leftmost lane. (c and d) SUD-M with mixtures of random DNA 20-mers, mixtures of random RNA 20-mers, and the RNA 20-mers (GGGA)5 and (ACUG)5. The same gel is stained for nucleic acid in (c) and for protein in (d). The protein concentrations are indicated above the gels, and the same concentrations apply to (e)–(h).  RNA (15 μM) is present in all, except for the leftmost lane. (e and f) SUD-MC with the same nucleic acids as in (c) and (d). (g and h) Same as (e) and (f) for the protein SUD-C. In all panels, RNA bands are indicated by filled triangles, the position of the protein is indicated by open triangles, and the RNA/protein complexes are indicated by open squares. The analysis of these data (see the text) considered that SUD-M does not enter the polyacrylamide gels because of its basic pI (calculated pI = 9.0) even when in complex with RNA. Binding to SUD-M was therefore inferred by the decrease in free RNA in the gel. SUD-MC has a pI value that is close to neutral (calculated pI = 6.7) and does not enter the gel on its own, but the (GGGA)5 complex is sufficiently stable and has enough negative charge to enter the gel and to be observed as a discrete band. SUD-C has a calculated pI value of 5.0 and enters the gel also in the absence of RNA (h). The appearance of multiple bands on the native gels for some of the G-rich RNAs is discussed in the text.
Fig. 7
Fig. 7
Gel-shift (EMSA) assays probing the interactions of SUD-M (left) and SUD-MC with 10-base RNAs containing different patterns of G and A. Above the gels, RNA sequences and protein concentrations are indicated.  RNA (30 μM) is present in all lanes of (a), (b), (e), and (f), and there is 150 μM RNA in all lanes of (c) and (d). The protein–nucleic acid mixtures in (e) and (f) were incubated in KCl buffer (for details, see Materials and Methods). In all panels, RNA bands are indicated by filled triangles, the position of the protein is indicated by open triangles, and the RNA/protein complexes are indicated by open rectangles labeled ‘Complex.’ The appearance of multiple bands on the native gels for some of the G-rich RNAs is discussed in the text, as is the smearing of some of the bands.
Fig. 8
Fig. 8
(a) Overlay of the 2D 15N,1H HSQC spectra of SUD-MC in the presence (blue) and in the absence (red) of A10 at an RNA/protein ratio of 1:1. (b) Expansions of regions I and II in the spectra of (a). Residues with chemical shift changes Δδ ≥ 0.03 ppm are labeled, where the labeling of those belonging to SUD-C is in italics. (c) Plot of chemical shift changes Δδ induced by A10 binding to SUD-MC, SUD-M, and SUD-C. Data are plotted versus the amino acid sequence of SUD-MC, using the following color code: SUD-MC, green; SUD-M, red; SUD-C, blue. The RNA/protein ratio was 1:1. For the amide group of each residue, Δδ was calculated as [Δδ(1H)2  + (Δδ(15N)/5)2]1/2. (d) Plot of chemical shift perturbations Δδ induced by RNA binding to the isolated SUD-C. The RNAs used were A10 (magenta), G10 (green), and U10 (black), and the RNA/protein ratio was 5:1.
Fig. 9
Fig. 9
Visualization of the RNA-binding protein surface areas implicated by the NMR chemical shift perturbation experiments of Fig. 8. (a) Perturbations induced on the surface of SUD-M by the addition of 1 Eq of A10 to SUD-MC. The residues with Δδ ≥ 0.03 (data plotted in green in Fig. 8c) are shown in green and labeled. (b) Electrostatic potential surface of SUD-M. The molecule is shown in the same orientation as in (a). Red, negatively charged areas; blue, positively charged areas; white, neutral areas. Selected surface residues are labeled. (c) Perturbations induced on the surface of SUD-C by the addition of 1 Eq of A10 to SUD-MC. The residues with Δδ ≥ 0.03 (data plotted in green in Fig. 8c) are shown in green and labeled. (d) Electrostatic potential surface of SUD-C. The molecule is shown in the same orientation as in (c), with the same color scheme as in (b). (e) Perturbations induced on the surface of SUD-C by the addition of a 5-fold excess of A10 to SUD-C. The residues with Δδ ≥ 0.03 (data plotted in magenta in Fig. 8d) are shown in magenta and labeled. In (c) to (e), the orientation of SUD-C is related to that of Fig. 1 by a rotation of approximately 90° about the horizontal axis in the projection plane.
Fig. 10
Fig. 10
Globular domains and nonglobular linker peptide segments formed by residues 1–1203 of nsp3. The globular domains are shown as ribbon presentations, flexibly disordered linker segments characterized by NMR spectroscopy are shown as blue lines, and disordered segments implicated by the absence of X-ray diffractions in crystallographic studies are represented by green lines. The black line at the top indicates the initial domain annotation based on bioinformatics and phylogenetic analyses. Abbreviations for the common names of the globular domains are shown below the structures: UB1, first ubiquitin-like domain; AC, acidic domain; ADRP, ADP-ribose-1″-phosphatase; SUD-N, N-terminal region of SUD; SUD-M, middle region of SUD; SUD-C, C-terminal region of SUD; UB2, second ubiquitin-like domain; PLpro, papain-like protease; NAB, nucleic-acid-binding domain.

References

    1. Peiris J.S., Guan Y., Yuen K.Y. Severe acute respiratory syndrome. Nat. Med. 2004;10:S88–S97. - PMC - PubMed
    1. Poon L.L., Guan Y., Nicholls J.M., Yuen K.Y., Peiris J.S. The aetiology, origins, and diagnosis of severe acute respiratory syndrome. Lancet Infect. Dis. 2004;4:663–671. - PMC - PubMed
    1. Perlman S., Netland J. Coronaviruses post-SARS: update on replication and pathogenesis. Nat. Rev. Microbiol. 2009;7:439–450. - PMC - PubMed
    1. Masters P.S. The molecular biology of coronaviruses. Adv. Virus Res. 2006;66:193–292. - PMC - PubMed
    1. Gorbalenya A.E., Snijder E.J., Spaan W.J. Severe acute respiratory syndrome coronavirus phylogeny: toward consensus. J. Virol. 2004;78:7863–7866. - PMC - PubMed

Publication types

MeSH terms

LinkOut - more resources