. 2010 Oct;38(18):6159-75.
doi: 10.1093/nar/gkq421. Epub 2010 May 21.

Origin and quantification of circulating DNA in mice with human colorectal cancer xenografts

Affiliations

Origin and quantification of circulating DNA in mice with human colorectal cancer xenografts

Alain R Thierry et al. Nucleic Acids Res. 2010 Oct.

Abstract

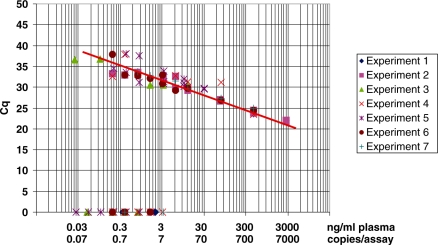
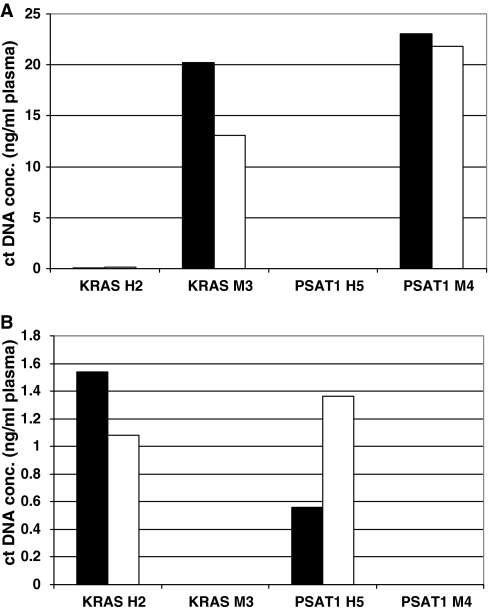
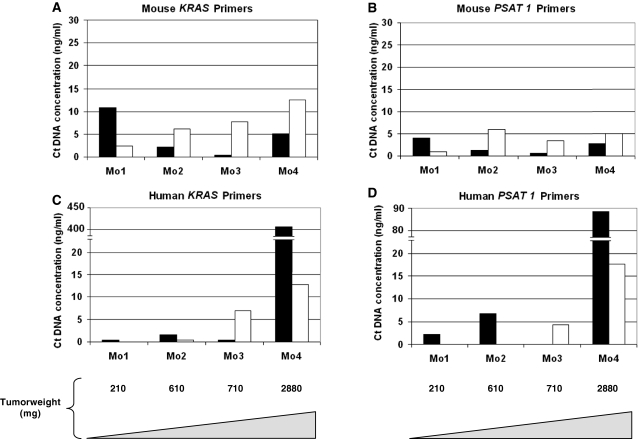
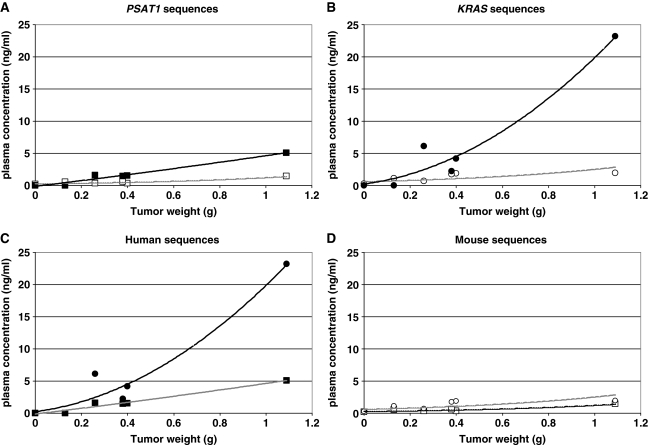
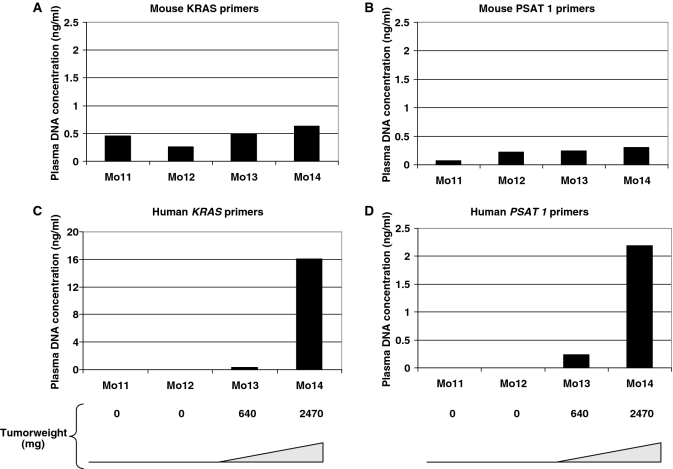
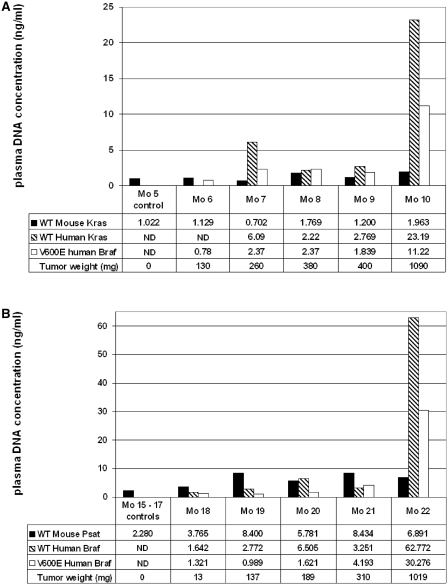
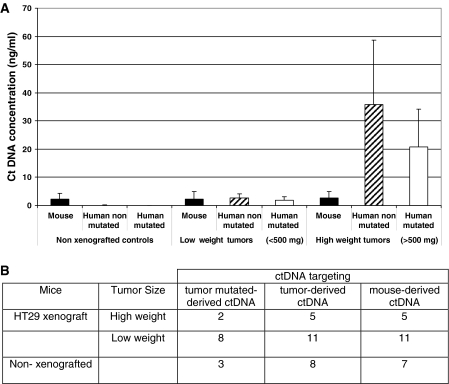
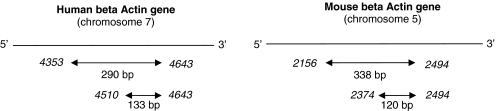
Although circulating DNA (ctDNA) could be an attractive tool for early cancer detection, diagnosis, prognosis, monitoring or prediction of response to therapies, knowledge on its origin, form and rate of release is poor and often contradictory. Here, we describe an experimental system to systematically examine these aspects. Nude mice were xenografted with human HT29 or SW620 colorectal carcinoma (CRC) cells and ctDNA was analyzed by Q-PCR with highly specific and sensitive primer sets at different times post-graft. We could discriminate ctDNA from normal (murine) cells and from mutated and non-mutated tumor (human) cells by using species-specific KRAS or PSAT1 primers and by assessing the presence of the BRAF V600E mutation. The concentration of human (mutated and non-mutated) ctDNA increased significantly with tumor growth. Conversely, and differently from previous studies, low, constant level of mouse ctDNA was observed, thus facilitating the study of mutated and non-mutated tumor derived ctDNA. Finally, analysis of ctDNA fragmentation confirmed the predominance of low-size fragments among tumor ctDNA from mice with bigger tumors. Higher ctDNA fragmentation was also observed in plasma samples from three metastatic CRC patients in comparison to healthy individuals. Our data confirm the predominance of mononucleosome-derived fragments in plasma from xenografted animals and, as a consequence, of apoptosis as a source of ctDNA, in particular for tumor-derived ctDNA. Altogether, our results suggest that ctDNA features vary during CRC tumor development and our experimental system might be a useful tool to follow such variations.


Figures

Figure 1.
Figure 1.
Sensitivity of the Q–PCR assay determined by plotting Cq and ctDNA concentrations on the y and x axis, respectively. Q–PCR analysis was performed using the KRAS H2 primer set with HCT116-s cell genomic DNA. Data obtained from seven different experiments are combined; each value obtained during these seven experiments carried out in separate runs is represented. The mathematical trend curve was a line of the equation y = –1.3538 ln(x) + 25 353 (R2 = 0.8973). Each individual standard curve from the seven experiments exhibited a R2 > 0.99. ctDNA concentration was expressed as ng/ml plasma and copies/assay. A factor of 6.6 pg of DNA per diploid cell is used for copy number conversion. The absolute equivalent amount of DNA in each sample was determined by a standard curve with serial DNA dilutions in 5 µl (50 ng–0.05 pg) in 25 µl total reaction volume.
Figure 2.
Figure 2.
Evaluation of the specificity of the Q–PCR systems targeting KRAS and PSAT1. Human KRAS H2, mouse KRAS M3, human PSAT1 H5 and mouse PSAT1 M4 primer sets were tested using plasma ctDNA extracts either from BALB/C mice (A) or from healthy human individuals (B). Results of amplifications with these PCR systems were expressed as plasma ctDNA concentration (ng/ml). Dark and light histograms represent the values of ctDNA concentration assessed in duplicates.
Figure 3.
Figure 3.
Comparison of ctDNA amount from serum (light bars) and plasma (dark bars) preparations. ctDNA concentration in plasma and serum from SW620 xenografts was determined using the mouse KRAS M3 (A), mouse PSAT1 M4 (B), human KRAS H2 (C) and human PSAT1 H5 (D) primer sets. ctDNA concentration for each mouse (Mo1, Mo2, Mo3 and Mo4) and the corresponding tumor weight (210, 610, 710 and 2880 mg, respectively) are shown. Values were calculated from duplicate experiments carried out twice.
Figure 4.
Figure 4.
ctDNA concentration relative to tumor weight in plasma of HT29 xenografts. ctDNA concentrations determined by Q–PCR analysis targeting human or mouse PSAT1 (A), human or mouse KRAS (B), human PSAT1 or KRAS (C) and mouse PSAT1 or KRAS (D) sequences were plotted in linear regression curves. ctDNA values obtained with mouse PSAT1 M4 (open square), human PSAT1 H5 (closed square), mouse KRAS M3 (open circle) and human KRAS H2 (closed circle) primer sets were expressed versus HT29 xenograft tumor weight. Control mouse (Mo5) corresponds to a non-xenografted athymic nude mouse (tumor weight = 0). Mo6–Mo10 bore tumors weighing 130, 280, 380, 400 and 1090 mg. Values were calculated from duplicate experiments carried out twice.
Figure 5.
Figure 5.
Determination of ctDNA concentration in plasma of SW620 xenografts by Q–PCR analysis. Plasma ctDNA amounts were measured in a control non-xenografted mouse (Mo11), in an unsuccessfully xenografted mouse (Mo12), and in mice with tumor of 640 mg (Mo13) and 2470 mg (Mo14). Experiments were carried out in duplicate and confirmed twice. Mouse KRAS (A), mouse PSAT1 (B), human KRAS (C) and human PSAT1 (D) primers correspond to KRAS M3, PSAT1 M4, KRAS H2 and PSAT1 H5. Data shown here are from a representative experiment performed in a single run.
Figure 6.
Figure 6.
Discrimination of mouse, human wild-type and mutated ctDNA amounts in xenografted mice. Two representative experiments (A and B) are presented. Histograms describe the quantification of wild-type mouse (black bar) and human wild-type (hatched bar) and mutated V600E ctDNA (light bar). V600E BRAF mutated ctDNA amount was determined by ASB–PCR in Mo5–10, which had been xenografted with HT29 cells, and compared to mouse (KRAS M3 primer set) and human (wild-type BRAF primer set) derived ctDNA (A). In the second experiment, plasma samples of another five HT29 xenografted mice (Mo18–Mo22) and three non-xenografted control mice (Mo15–17) were used to quantify ctDNA using the PSAT1 M4, wild-type BRAF and V600E BRAF primer sets (B). Experiments were carried out in duplicate in a single run and confirmed twice. The total concentration of human ctDNA can be obtained by adding together the amount of mutated and non-mutated ctDNA as the V600E mutation is heterozygous in HT29 cells. ND, not detected.
Figure 7.
Figure 7.
ctDNA concentration and tumor burden. All the data obtained in this study (A) were combined and separated in three categories: mice with high weight tumor (>500 mg, n = 5), low weight tumor (100–500 mg, n = 11) and non-xenografted nude mice (n = 8). Number of mouse plasma samples analyzed for each tumor mass category (B). In addition, we combined all KRAS and PSAT1 ctDNA concentrations obtained in this study from mouse plasma samples of HT29 xenografts. Human derived (tumor mutated and non-mutated) ctDNA as well as mouse derived ctDNAs were quantified in each category. Statistical evaluation of the significance of the differences among groups (P-values, from the Student’s t-test) is presented in Supplementary Data S5.
Figure 8.
Figure 8.
Schematic of the primer sets used for evaluating ctDNA fragmentation in plasma of xenografted mice by targeting mouse or human ACTB sequences. Numbers in italics represent the nucleotide position of the ACTB sequences according to the FASTA format (5 566 782 for HuACTB and 143 665 420 for MoACTB).

References

    1. Mandel P, Metais P. Les acides nucleiques du plasma sanguin chez l’homme. C. R. Seances Soc. Biol. Fil. 1948;142:241–243. - PubMed
    1. Stroun M, Anker P, Lyautey J, Lederrey C, Maurice PA. Isolation and characterization of DNA from the plasma of cancer patients. Eur J. Cancer Clin. Oncol. 1987;23:707–712. - PubMed
    1. Gormally E, Hainaut P, Caboux E, Airoldi L, Autrup H, Malaveille C, et al. Amount of DNA in plasma and cancer risk: a prospective study. Int. J. Cancer. 2004;111:746–749. - PubMed
    1. Sawyers CL. The cancer biomarker problem. Nature. 2008;452:548–552. - PubMed
    1. Fleischhacker M, Schmidt B. Circulating nucleic acids (CNAs) and cancer–a survey. Biochim. Biophys. Acta. 2007;1775:181–232. - PubMed

Publication types