. 2010 Jul 30;285(31):24141-53.
doi: 10.1074/jbc.M109.098525. Epub 2010 May 21.

Reactive oxygen species, Ki-Ras, and mitochondrial superoxide dismutase cooperate in nerve growth factor-induced differentiation of PC12 cells

Affiliations

Reactive oxygen species, Ki-Ras, and mitochondrial superoxide dismutase cooperate in nerve growth factor-induced differentiation of PC12 cells

Silvana Cassano et al. J Biol Chem. .

Abstract

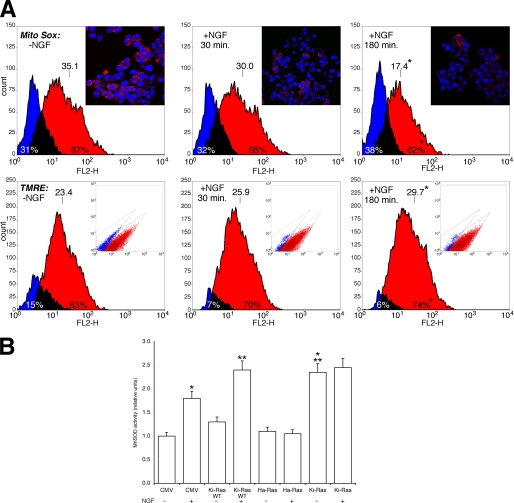
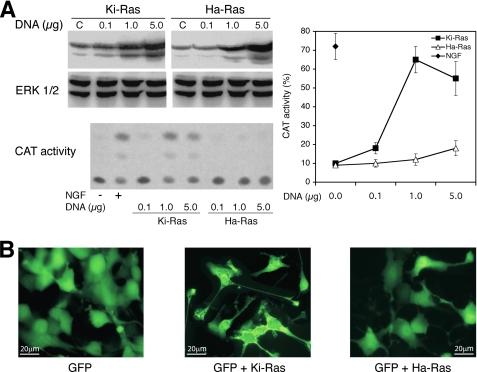
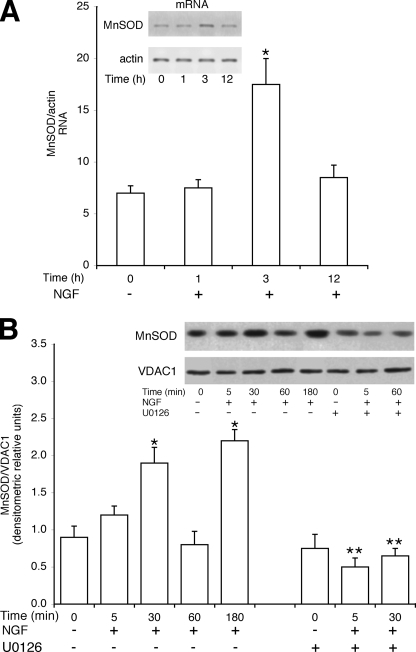
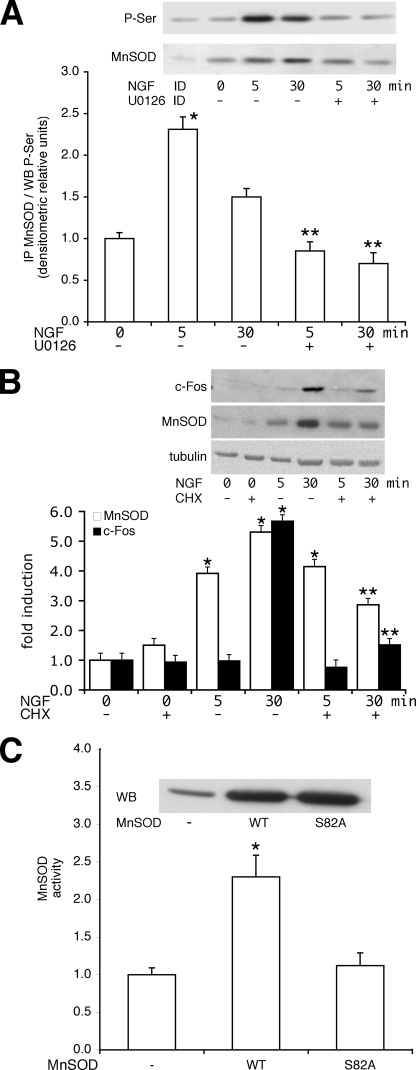
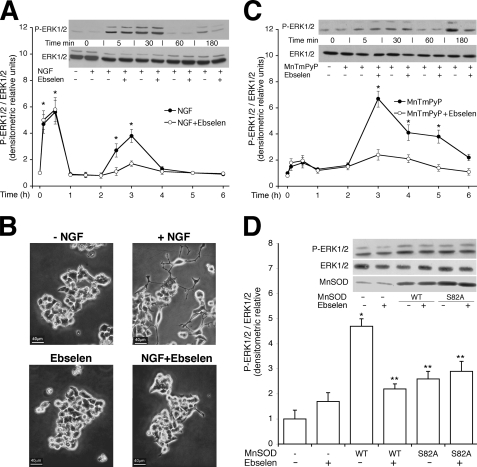
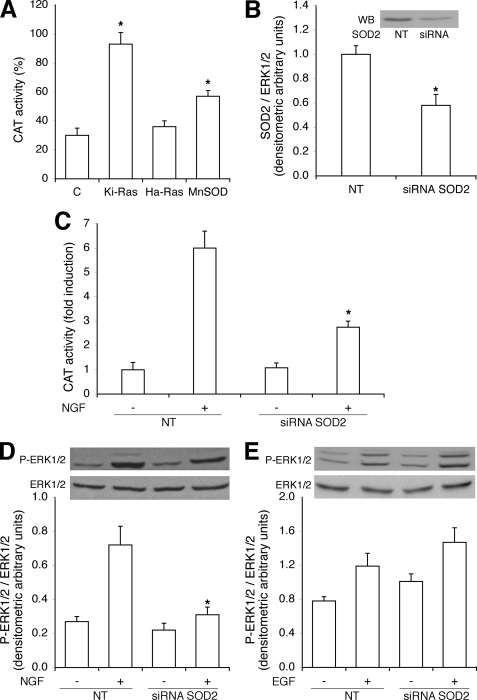
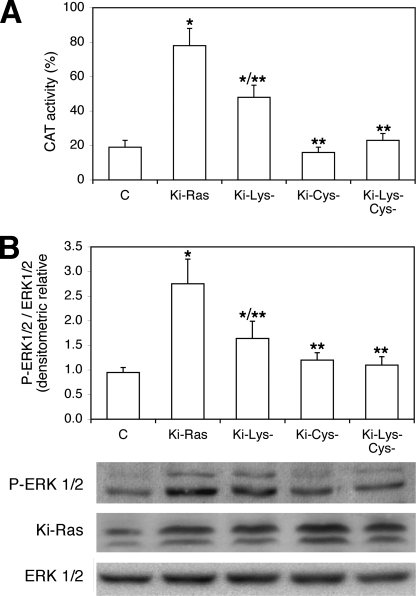
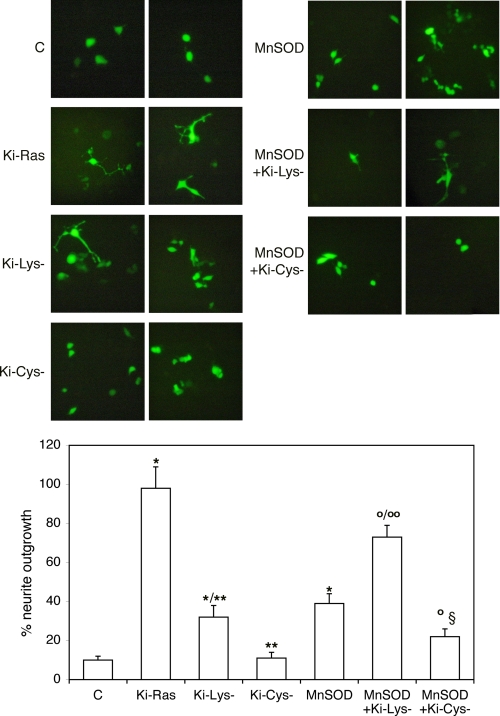
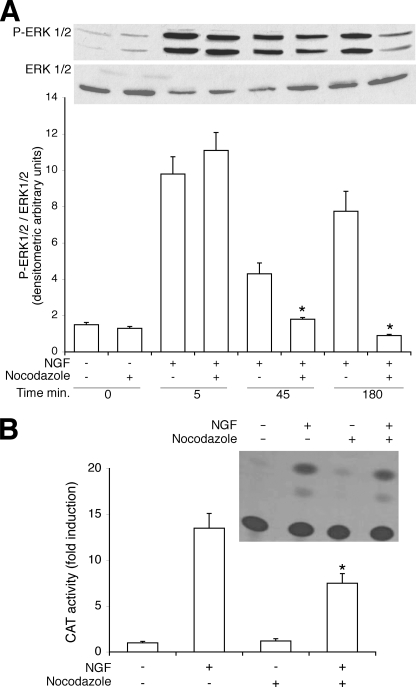
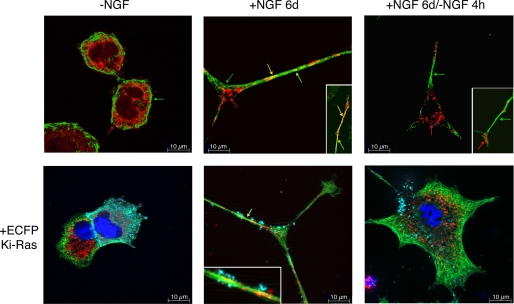
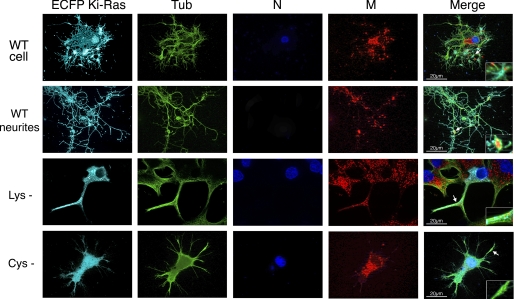
Nerve growth factor (NGF) induces terminal differentiation in PC12, a pheochromocytoma-derived cell line. NGF binds a specific receptor on the membrane and triggers the ERK1/2 cascade, which stimulates the transcription of neural genes. We report that NGF significantly affects mitochondrial metabolism by reducing mitochondrial-produced reactive oxygen species and stabilizing the electrochemical gradient. This is accomplished by stimulation of mitochondrial manganese superoxide dismutase (MnSOD) both transcriptionally and post-transcriptionally via Ki-Ras and ERK1/2. Activation of MnSOD is essential for completion of neuronal differentiation because 1) expression of MnSOD induces the transcription of a neuronal specific promoter and neurite outgrowth, 2) silencing of endogenous MnSOD by small interfering RNA significantly reduces transcription induced by NGF, and 3) a Ki-Ras mutant in the polylysine stretch at the COOH terminus, unable to stimulate MnSOD, fails to induce complete differentiation. Overexpression of MnSOD restores differentiation in cells expressing this mutant. ERK1/2 is also downstream of MnSOD, as a SOD mimetic drug stimulates ERK1/2 with the same kinetics of NGF and silencing of MnSOD reduces NGF-induced late ERK1/2. Long term activation of ERK1/2 by NGF requires SOD activation, low levels of hydrogen peroxide, and the integrity of the microtubular cytoskeleton. Confocal immunofluorescence shows that NGF stimulates the formation of a complex containing membrane-bound Ki-Ras, microtubules, and mitochondria. We propose that active NGF receptor induces association of mitochondria with plasma membrane. Local activation of ERK1/2 by Ki-Ras stimulates mitochondrial SOD, which reduces reactive oxygen species and produces H(2)O(2). Low and spatially restricted levels of H(2)O(2) induce and maintain long term ERK1/2 activity and ultimately differentiation of PC12 cells.


Figures

FIGURE 1.
FIGURE 1.
A, NGF reduces mitochondrial ROS levels and stabilizes the proton gradient in PC12 cells. Upper panel, ROS levels were determined by MitoSOX fluorescence in cells treated with NGF at (100 ng/ml) for 30 and 180 min as indicated. The histogram was obtained by overlapping the regions identified by bivariate analysis. Overlay plots are shown, where blue and red colors indicate the negative and positive cells, respectively. The number of cells and the intensity of the fluorescence are shown on the ordinate and abscissa, respectively. The inset shows representative micrographs of the same cells stained with the specific nuclear dye DRAQ 5 (see “Experimental Procedures”). Lower panel, the mitochondrial proton gradient was measured by TMRE fluorescence-activated cell sorter analysis. Overlay plots are shown, where blue and red indicate the negative and positive cells, respectively. The inset shows the different populations of the cells identified by bivariate analysis. Overlay plots are shown, where blue and red colors indicate the negative and positive cells, respectively. *, p < 0.01 relative to cells without NGF. B, MnSOD activity in Ha and Ki-Ras-expressing cells is shown. Cells were transfected with expression vectors carrying the empty CMV vector, wild type Ki-Ras4B, Ha-Ras (Val-12), Ki-Ras (Val-12), described under “Experimental Procedures.” 48 h later cells were induced with NGF (100 ng/ml) for 30 min as indicated. MnSOD activity was carried out as described under “Experimental Procedures.”. Values, normalized to the transfection efficiency (RSV-LacZ), represent the means ± S.E. derived from at least three independent experiments performed in triplicate. *, p < 0.01 relative to untreated cells transfected with CMV. **, p < 0.02 relative to cells transfected with CMV and treated with NGF. ***, p < 0.01 relative to untreated cells expressing Ki-Ras wild type (WT).
FIGURE 2.
FIGURE 2.
Ha-Ras and Ki-Ras effects on PC12 differentiation. A, induction of NGF1A promoter transcription by Ki- and Ha-Ras is shown. PC12 cells were transfected with control vector, NGF1A promoter fused to CAT, and Ki- or Ha-Ras (Val-12) expression vectors. 40 h later the cells were serum-starved for 5 h and treated 4 h with 100 ng/ml NGF. The left upper panel shows the immunoblot with Ha- and Ki-Ras-specific antibodies of extracts derived from cells transfected with various concentrations of Ha- or Ki-Ras expression vectors. The left lower panel shows a representative CAT assay, where the lower and the upper spots indicate the input chloramphenicol and the acetylated products, respectively. The right panel shows the CAT activity (% of acetylated chloramphenicol) normalized to the transfection efficiency (β-galactosidase activity). The values shown represent the means ± S.E., derived from at least three independent experiments performed in triplicate. Total p-ERK and GTP binding activity were comparable in cells transfected with 1 and 5 μg/dish DNA of both Ras vectors. B, neurite outgrowth in cells expressing Ha- or Ki-Ras is shown. Ha- and Ki-Ras expression vectors contain the internal ribosome entry site of the encephalomyocarditis virus upstream of the GFP gene (“Experimental Procedures”) and express co-translationally GFP. Cells transfected, as described in A, were analyzed by fluorescence microscopy 72 h later. Specifically, neurites were scored in 200 cells GFP+: control, 4 ± 1.78%; Ki-Ras, 40 ± 9.13%; Ha-Ras 15 ± 5.61%. For each experiment the p value of the χ2 was <0.001; across the experiment the p values of the t tests were: Ki-Ras versus control, p < 0.0001; Ha-Ras versus control, p = 0.0011; Ki-Ras versus Ha-Ras, p < 0.0001.
FIGURE 3.
FIGURE 3.
NGF stimulates mitochondrial SOD. A, NGF induces MnSOD mRNA. PC12 cells were stimulated 1, 3, and 12 h with NGF (100 ng/ml), and total RNA was extracted and reverse-transcribed in cDNA as described under “Experimental Procedures.” Specific primers corresponding to rat MnSOD were used to amplify the specific SOD mRNA. The amount of the specific RNA band was linearly dependent on the concentration of cDNA and number of cycles. Values are the means ± S.E. derived from at least three experiments performed in triplicate. A representative experiment is shown in the inset. *, p < 0.01 relative to untreated cells. B, NGF stimulates mitochondrial MnSOD protein levels. PC12 cells were treated with 100 ng/ml NGF for the periods indicated. UO126 (10 μm) was added 15 min before NGF challenge. The mitochondrial fraction was prepared as described under “Experimental Procedures.” 30 μg of proteins were immunoblotted with anti-MnSOD and voltage-dependent anion channel 1 (VDAC1, a specific mitochondrial marker). Values are the means ± S.E. derived from at least three experiments, performed in triplicate. *, p < 0.01 relative to untreated cells. **, p < 0.01 relative to cells stimulated with NGF for 5 and 30 min without U0126.
FIGURE 4.
FIGURE 4.
Post-transcriptional regulation of mitochondrial SOD by NGF. A, NGF induces phosphorylation of MnSOD. Extracts (1 mg) derived from PC12 cells and induced for 5 and 30 min by NGF or pretreated with the MEK inhibitor U0126 (10 μm) were immunoprecipitated with the anti-MnSOD mouse monoclonal antibody. The immunoprecipitate (IP), fractionated on an SDS-polyacrylamide gel, was challenged with anti-phosphoserine (P-Ser) rabbit polyclonal antibodies or anti-MnSOD rabbit polyclonal antibodies (see “Experimental Procedures”). The histogram shows the densitometric analysis of MnSOD serine-phosphorylated band relative to control protein in untreated cells. The inset panel shows a representative blot (WB) with anti-phosphoserine or anti-MnSOD antibodies. ID indicates MnSOD-immunodepleted extracts from 30 min NGF-treated cells. *, p < 0.01 relative to untreated cells. **, p < 0.01 relative to cells stimulated with NGF for 5 and 30 min, respectively. B, shown is the effect of inhibition of protein synthesis on NGF-induced MnSOD. 50 μg of extracts, derived from PC12 cells, were challenged for 5 and 30 min with NGF in the presence or absence of cycloheximide (CHX, 10 μg/ml). The cells were starved from serum for 4 h, and the cycloheximide was added 30 min before NGF treatment. The immunoblot of total cell protein was carried out with antibodies specific to human c-Fos (goat) and MnSOD. A representative experiment is shown in the inset. *, p < 0.01 relative to untreated cells. **, p < 0.01 relative to cells stimulated with NGF for 30 min without cycloheximide. C, mitochondrial SOD activity of wild type or the serine/alanine 82 mutant is shown. Cells (HEK293, PC12, and HeLa) were transiently transfected with control vector, wild type, or alanine (S82A) MnSOD mutant expression vectors. Cell extracts were prepared and assayed for MnSOD activity as described under “Experimental Procedures.” The results were comparable in the three cell lines indicated. The inset shows the levels of MnSOD in HEK293 transfected with the wild type or S82A MnSOD proteins. The histogram shows the enzymatic activity of wild type (WT) and MnSOD mutant HEK293-expressing cells normalized to the transfection efficiency. *, p < 0.01 relative to control cells.
FIGURE 5.
FIGURE 5.
MnSOD influences NGF-induced ERK1/2 activity. A, a peroxide scavenger abolishes long term ERK1/2 stimulation by NGF. The time-course of ERK1/2 induction by NGF is shown. PC12 cells were treated with NGF (100 ng/ml) for the times indicated in the absence or presence of the peroxide scavenger (ebselen 20 μm for 30 min). 50 μg of proteins were immunoblotted with anti-p-ERK1/2. The values shown in the histogram represent the means ± S.E. derived from of at least three experiments performed in triplicate. The inset shows a representative experiment. *, p < 0.01 relative to untreated cells. B, a peroxide scavenger inhibits neurite outgrowth induced by NGF. The same cells indicated in A were plated in the presence of NGF for 5 days in the presence or absence of 20 μm ebselen. Viability of the cells, measured by fluorescence-activated cell sorter, was not affected under these conditions. Neurite outgrowth was measured as described under “Experimental Procedures” except that neurites whose length was 0.5 and 1 times the cell body were also measured. 200 cells were counted for each plate, and the percentage of cells with neurites was calculated as described (6). Control, 6 ± 2%: +NGF, 75 ± 10%; +NGF-Ebselen 25 ± 10%; NGF versus control, p < 0.001; NGF versus ebselen + NGF, p < 0.02. The experiment was performed in triplicate. The viability of cells treated with 20 μm ebselen for 5 days was not significantly different from control cells, assayed by cytofluorimetry. C, long term ERK1/2 stimulation by SOD mimetic drugs is shown. Time-course of ERK1/2 induction by MnTMPyP (100 μm), a SOD mimetic drug is shown. PC12 cells were treated with MnTPyP for the times indicated in the absence or presence of ebselen (20 μm for 30 min). ERK1/2 activation was assayed by immunoblot with specific antibodies anti-p-ERK1/2. Values represent the means ± S.E. of at least three experiments performed in triplicate (lower panel). A representative experiment is shown in the upper panel. *, p < 0.01 relative to untreated cells. D, MnSOD stimulates ERK1/2. Several cell lines (HEK293, PC12, HeLa) were transfected with control vector, wild type (WT), and mutant (S82A) MnSOD expression vectors. 24 h later the cells were serum-deprived for 18 h and incubated in the presence of 20 μm ebselen for 3 h. Total extracts were prepared as described under “Experimental Procedures,” and 50 μg of proteins were immunoblotted with anti-p-ERK1/2 and anti-MnSOD antibodies. The values shown in the histogram are the means ± S.E. of at least three experiments, performed in triplicate. A representative experiment performed in HEK293 cells is shown in the upper panel. *, p < 0.01 relative to untreated control cells; **, p < 0.01 relative to untreated cells expressing wild type MnSOD.
FIGURE 6.
FIGURE 6.
MnSOD silencing impairs NGF-induced differentiation. A, MnSOD stimulates transcription of NFG1A promoter. CAT assay in cells transfected with Ki-Ras (2.5 μg), Ha-Ras (5 μg), and MnSOD (1 μg/3 ml/60 mm dish) expression vectors, normalized to the transfection efficiency, as described in “Experimental Procedures.” Values represent the means ± S.E. of at least three experiments performed in triplicate. *, p < 0.01 relative to control cells. B–E, MnSOD knockdown reduces NGF1A promoter transcription and ERK1/2 stimulation by NGF, not by EGF. Cells were transfected by electroporation with siRNA to MnSOD (siRNA SOD2) and control and scrambled siRNA (NT) as described under “Experimental Procedures.” 72 h later total proteins were extracted and subjected to the specific assays as indicated under “Experimental Procedures.” Values indicate the means ± S.E. derived from at least three experiments performed in triplicate. B, the upper panel shows a representative immunoblot (WB) with anti-MnSOD antibodies. *, p < 0.01 relative to cells transfected with NT. C, transcription of NGF1A promoter in the presence or absence of NGF is shown. D and E, ERK1/2 immunoblot in control or MnSOD silenced cells challenged with NGF (100 ng/ml, 3 h) or EGF (100 ng/ml 15 min) is shown. Values represent the means ± S.E. of at least three experiments performed in triplicate. In panels C and D, *, p < 0.01 relative to NGF treated cells transfected with NT.
FIGURE 7.
FIGURE 7.
Impact on PC12 differentiation of wild type and COOH-terminal Ki-Ras mutants. A, shown is NFG1A transcription in cells expressing Ki-Ras mutants at the COOH terminus. Ki-Ras (Val-12) mutants at the COOH terminus (5 lysines converted in alanine in the basic region are referred as Lys−, and cysteine of the CAAX box converted in alanine is referred as Cys−; see Ref. 1) were transfected and assayed for stimulation of NGF1A promoter activity. Values represent the means ± S.E. of at least three experiments performed in triplicate. * indicates p < 0.01 relative to control cells (C). ** indicates p < 0.01 relative to cells transfected with Ki-Ras. B, ERK1/2 activation by Ki-Ras mutants. In the same cells indicated in A, p-ERK1/2 was measured by immunoblot with specific antibodies. In the lower panel a representative immunoblot of Ki-Ras and p-ERK1/2 is shown. Values are the mean ± S.E. of at least three experiments performed in triplicate. *, p < 0.01 relative to control cells. **, p < 0.01 relative to cells transfected with Ki-Ras.
FIGURE 8.
FIGURE 8.
Neurite outgrowth in cells expressing Ki-Ras mutants and MnSOD. PC12 cells were transiently co-transfected with Ki-Ras (Val-12) mutants, MnSOD, and GFP as indicated on each fluorescence micrograph. Control (C) cells were transfected only with GFP. Three days later the neurite length was scored as described under “Experimental Procedures” in at least 200 cells/dish. Non-transfected or control cells did not show appreciable neurite outgrowth. On the bottom, the statistical analysis of cells displaying neurites derived from three experiments is shown (see “Experimental Procedures”). *, p < 0.01 relative to control cells; **, p < 0.01 relative to cells transfected with Ki-Ras; °, p < 0.01 relative to cells transfected with MnSOD; °°, p < 0.01 relative to cells transfected with Ki-Lys−; §, indicates p < 0.01 relative to cells transfected with Ki-Cys−. We noticed that in MnSOD-transfected cells, all transfected cells displayed shorter neurites, whereas in Lys− -transfected cells, only a smaller fraction of the cells displayed longer neurites.
FIGURE 9.
FIGURE 9.
NGF stimulates the assembly of a macromolecular complex containing membrane, mitochondria, and cytoskeleton. A, long term ERK1/2 stimulation by NGF is impaired by nocodazole. Cells were treated with NGF (100 ng/ml) for the times indicated in the presence or absence of nocodazole (2 μm for 3 h) and analyzed for ERK1/2 activation by immunoblot with specific antibodies. Values shown represent the means ± S.E. of at least three experiments performed in triplicate (lower panel). A representative experiment is shown in the upper panel. *, p < 0.01 relative to cells treated only with NGF at the same time. The viability of the cells was not affected by 45 and 180 min of treatment with nocodazole. B, nocodazole inhibits NGF1A transcription. Cells were transfected with the CAT plasmids indicated in Fig. 2A, and 40 h later the cells were serum-starved for 5 h and treated for 4 h with 100 ng/ml NGF in the presence or absence of nocodazole (2 μm). The data are shown as CAT activity (-fold induction) normalized to the transfection efficiency. A representative autoradiogram is shown in the upper panel. CMV-LacZ expression and the viability of the cells were not affected by 4 h of treatment with nocodazole (2 μm). *, p < 0.01 relative to cells treated with NGF. Nocodazole (4 μm for 1 and 3 h) is not toxic and induces dispersion of mitochondrial clusters (49, 50).3
FIGURE 10.
FIGURE 10.
NGF induces clustering of mitochondria, microtubules, and Ki-Ras. Staining with mitotracker and anti-α-tubulin antibodies of PC12 cells exposed to NGF for 6 days (complete differentiation) is shown. Differentiated cells were cultured for 4 h in the absence of NGF (6d/NGF 4 h). The lower panels show cells transfected with ECFP-Ki-Ras, as indicated under “Experimental Procedures.” Cells were analyzed by structured epifluorescence illumination. On the left panel two cells are shown expressing high or lower levels of Ki-Ras. In both cells the signal appears to be specifically localized on the plasma membrane. In the insets of the central panels a 5× magnification of the neurite is shown to illustrate the co-localization of microtubules (green) and mitochondria (red) in proximity of Ki-Ras signal. In this panel a neurite that splits in two branches is shown. In the right panels, NGF was withdrawn for 4 h. The signals corresponding to mitochondria (red) and microtubules (green) appear dissociated, although the neurite is morphologically well delimited. We have scored at least 100 cells/sample in duplicate dishes, and this pattern was found in 70 ± 15% of the cells.
FIGURE 11.
FIGURE 11.
Ki-Ras mutants at the COOH terminus are unable to assemble mitochondria and cytoskeleton under the membrane. PC12 cells were transfected with wild type Ki-Ras or the Lys− or Cys− mutant versions (see “Experimental Procedures”) and stimulated with 100 ng/ml NGF for 3 days. Cells were stained with anti-α-tubulin antibodies (green, Tub), mitotracker (red, M), and Hoechst (blue, N) as described under in “Experimental Procedures.” Specifically cell bodies (cell) or neurites were selected and scored. Ki-Ras is shown in light blue. Although the number and the length of neurites were considerably lower in the cells expressing Ki-Ras mutants (Lys− and Cys−), the neurites did not present significant alteration of the microtubular network. Cells expressing wild type Ras display discrete regions where the tubulin, mitotracker and Ki-Ras signals overlap (arrows in wild type (WT) cell). Co-localization was lost in Ki-Ras Cys− -expressing cells. In Lys− -expressing cells, the signals corresponding to Ki-Ras, mitochondria, and α-tubulin did not overlap. The insets show a 5× magnification of the plasma membrane regions where Ki-Ras is localized. The patterns shown are representative of at least 60 ± 18% of the cells scored, on average 50 ± 15% per duplicate samples.

Similar articles

Cited by

References

    1. Santillo M., Mondola P., Serù R., Annella T., Cassano S., Ciullo I., Tecce M. F., Iacomino G., Damiano S., Cuda G., Paternò R., Martignetti V., Mele E., Feliciello A., Avvedimento E. V. (2001) Curr. Biol. 11, 614–619 - PubMed
    1. Cuda G., Paternò R., Ceravolo R., Candigliota M., Perrotti N., Perticone F., Faniello M. C., Schepis F., Ruocco A., Mele E., Cassano S., Bifulco M., Santillo M., Avvedimento E. V. (2002) Circulation 105, 968–974 - PubMed
    1. Suzukawa K., Miura K., Mitsushita J., Resau J., Hirose K., Crystal R., Kamata T. (2000) J. Biol. Chem. 275, 13175–13178 - PubMed
    1. Ibi M., Katsuyama M., Fan C., Iwata K., Nishinaka T., Yokoyama T., Yabe-Nishimura C. (2006) Free Radic. Biol. Med. 40, 1785–1795 - PubMed
    1. Sampath D., Jackson G. R., Werrbach-Perez K., Perez-Polo J. R. (1994) J. Neurochem. 62, 2476–2479 - PubMed

Publication types

LinkOut - more resources