

Single-molecule enzyme-linked immunosorbent assay detects serum proteins at subfemtomolar concentrations
- PMID: 20495550
- PMCID: PMC2919230
- DOI: 10.1038/nbt.1641
Single-molecule enzyme-linked immunosorbent assay detects serum proteins at subfemtomolar concentrations
Abstract
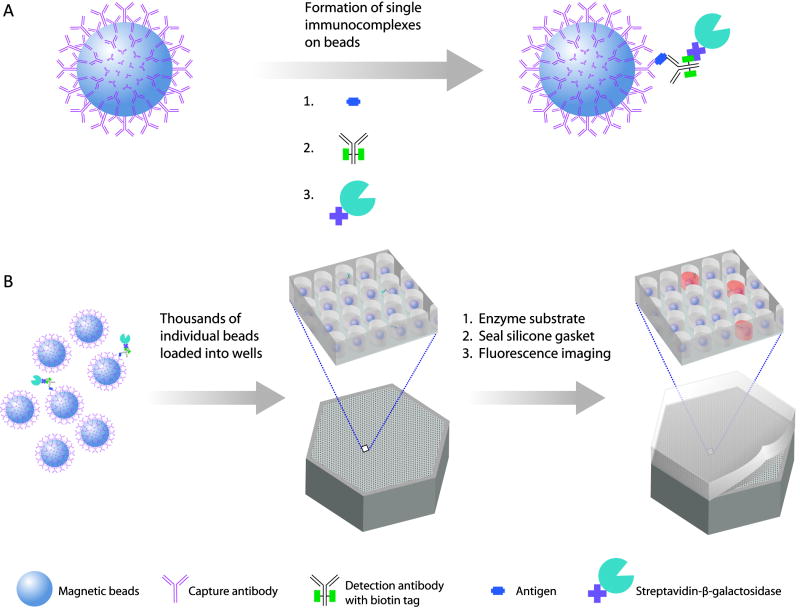
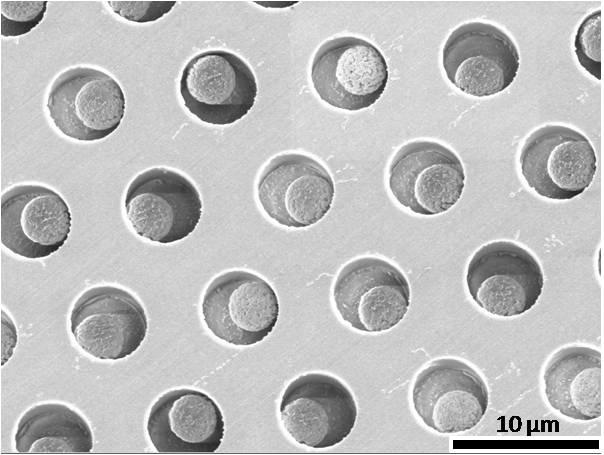
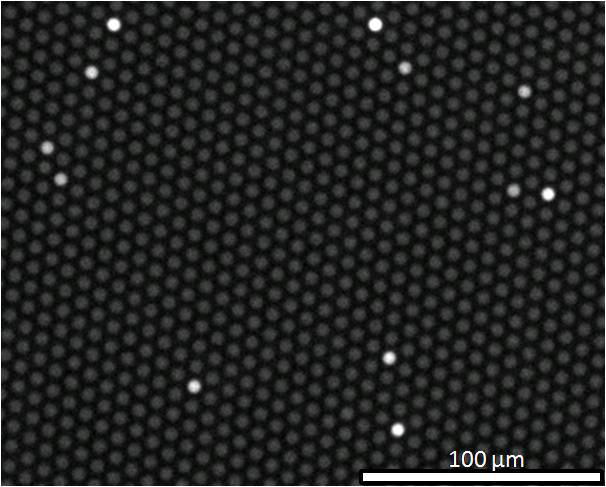
The ability to detect single protein molecules in blood could accelerate the discovery and use of more sensitive diagnostic biomarkers. To detect low-abundance proteins in blood, we captured them on microscopic beads decorated with specific antibodies and then labeled the immunocomplexes (one or zero labeled target protein molecules per bead) with an enzymatic reporter capable of generating a fluorescent product. After isolating the beads in 50-fl reaction chambers designed to hold only a single bead, we used fluorescence imaging to detect single protein molecules. Our single-molecule enzyme-linked immunosorbent assay (digital ELISA) approach detected as few as approximately 10-20 enzyme-labeled complexes in 100 microl of sample (approximately 10(-19) M) and routinely allowed detection of clinically relevant proteins in serum at concentrations (<10(-15) M) much lower than conventional ELISA. Digital ELISA detected prostate-specific antigen (PSA) in sera from patients who had undergone radical prostatectomy at concentrations as low as 14 fg/ml (0.4 fM).
Conflict of interest statement
Figures
 ), healthy control samples (
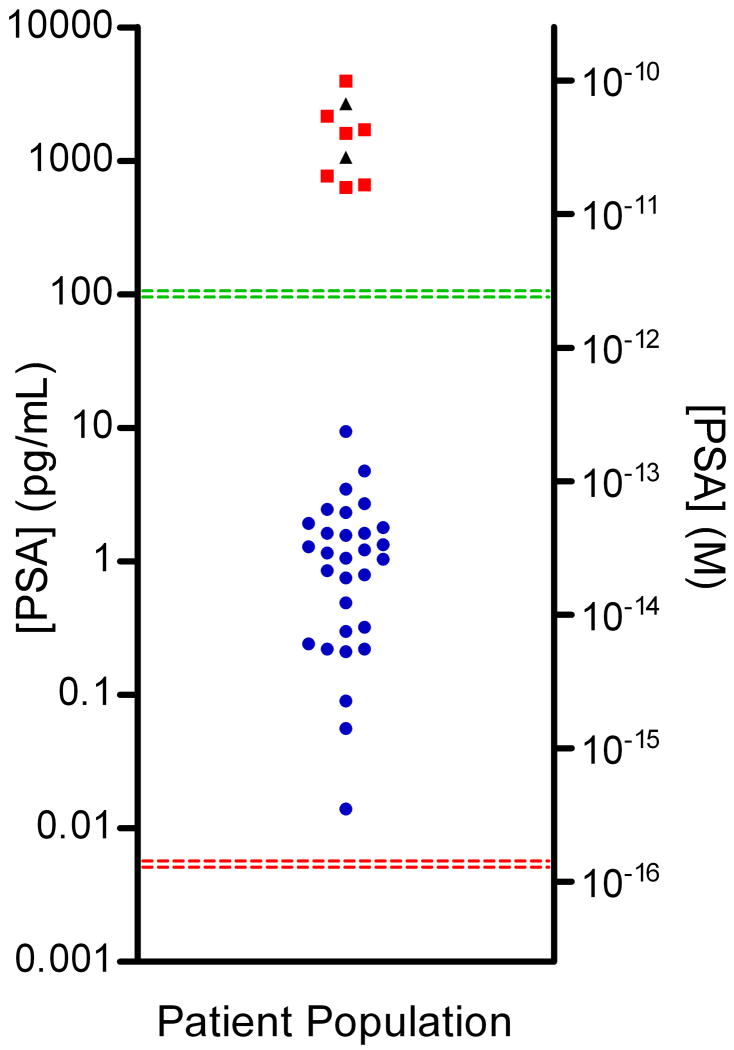
 ), and Bio-Rad PSA control samples (▲) determined using digital ELISA. RP patient samples (SeraCare Life Sciences, Milford, MA) all had undetectable PSA levels as measured by a leading clinical diagnostic assay (ADVIA Centaur); the green line represents the detection limit of the ADVIA Centaur PSA assay (100 pg/mL or 3 pM). All 30 patient samples were above the detection limit of the PSA digital ELISA, shown by the red line (0.006 pg/mL or ~200 aM), with the lowest patient PSA concentrations measured at 0.014 pg/mL (~400 aM) using digital ELISA. Patient samples with the lowest PSA levels were detectable, but approached the LOD of the assay resulting in a large imprecision in the concentration determined (high dose %CV). The digital ELISA was validated for specificity to PSA using control standards (Bio-Rad) and serum from healthy individuals (ProMedDx) that had been assayed using the ADVIA Centaur PSA assay (See Supplementary Table 3).
 ), healthy control samples (), and Bio-Rad PSA control samples (▲) determined using digital ELISA. RP patient samples (SeraCare Life Sciences, Milford, MA) all had undetectable PSA levels as measured by a leading clinical diagnostic assay (ADVIA Centaur); the green line represents the detection limit of the ADVIA Centaur PSA assay (100 pg/mL or 3 pM). All 30 patient samples were above the detection limit of the PSA digital ELISA, shown by the red line (0.006 pg/mL or ~200 aM), with the lowest patient PSA concentrations measured at 0.014 pg/mL (~400 aM) using digital ELISA. Patient samples with the lowest PSA levels were detectable, but approached the LOD of the assay resulting in a large imprecision in the concentration determined (high dose %CV). The digital ELISA was validated for specificity to PSA using control standards (Bio-Rad) and serum from healthy individuals (ProMedDx) that had been assayed using the ADVIA Centaur PSA assay (See Supplementary Table 3).
References
-
- Tessler LA, Reifenberger JG, Mitra RD. Protein Quantification in Complex Mixtures by Solid Phase Single-Molecule Counting. Analytical Chemistry. 2009;81:7141–7148. - PubMed
-
- Todd J, et al. Ultrasensitive flow-based immunoassays using single-molecule counting. Clinical Chemistry. 2007;53:1990–1995. - PubMed
-
- Gosling JP. A DECADE OF DEVELOPMENT IN IMMUNOASSAY METHODOLOGY. Clinical Chemistry. 1990;36:1408–1427. - PubMed
-
- Wild D. The Immunoassay Handbook, 3rd Edition. Third Edition. Elsevier; 2005. p. 930.
-
- Zhang HQ, Zhao Q, Li XF, Le XC. Ultrasensitive assays for proteins. Analyst. 2007;132:724–737. - PubMed
Publication types
MeSH terms
Substances
Grants and funding
LinkOut - more resources
Full Text Sources
Other Literature Sources
Molecular Biology Databases
Research Materials
Miscellaneous
