

Fitting of bone mineral density with consideration of anthropometric parameters
- PMID: 20495903
- PMCID: PMC2996478
- DOI: 10.1007/s00198-010-1284-4
Fitting of bone mineral density with consideration of anthropometric parameters
Abstract
A new model describing normal values of bone mineral density in children has been evaluated, which includes not only the traditional parameters of age, gender, and race, but also weight, height, percent body fat, and sexual maturity. This model may constitute a better comparative norm for a specific child with given anthropometric values.
Introduction: Previous descriptions of children's bone mineral density (BMD) by age have focused on segmenting diverse populations by race and gender without adjusting for anthropometric variables or have included the effects of anthropometric variables over a relatively homogeneous population.
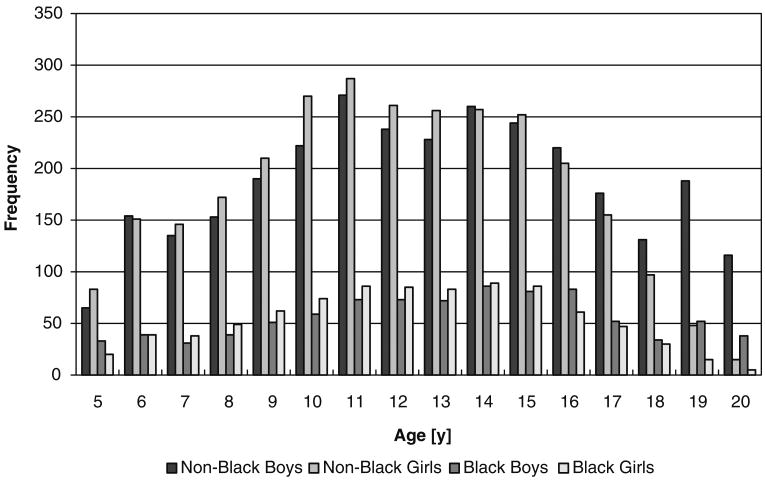
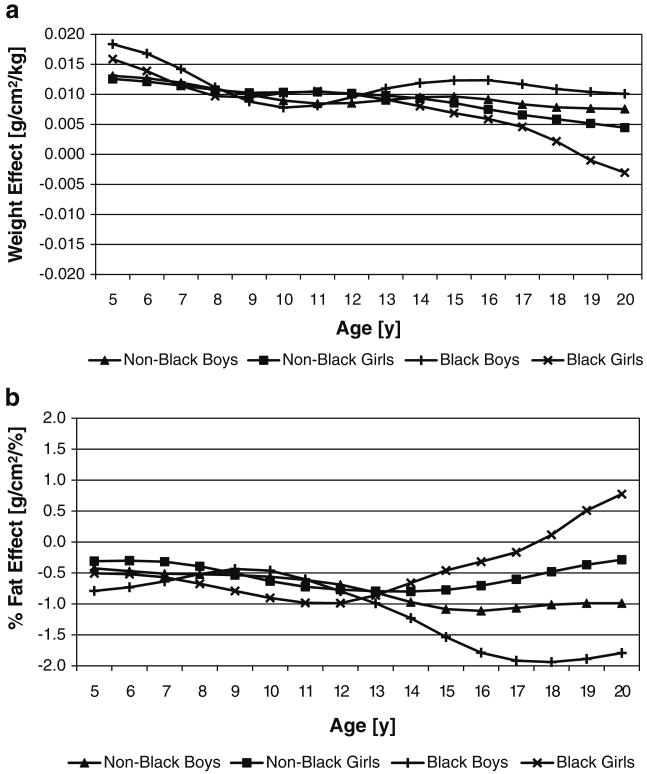
Methods: Multivariate semi-metric smoothing (MS(2)) provides a way to describe a diverse population using a model that includes multiple effects and their interactions while producing a result that can be smoothed with respect to age in order to provide connected percentiles. We applied MS(2) to spine BMD data from the Bone Mineral Density in Childhood Study to evaluate which of gender, race, age, height, weight, percent body fat, and sexual maturity explain variations in the population's BMD values. By balancing high adjusted R (2) values and low mean square errors with clinical needs, a model using age, gender, race, weight, and percent body fat is proposed and examined.
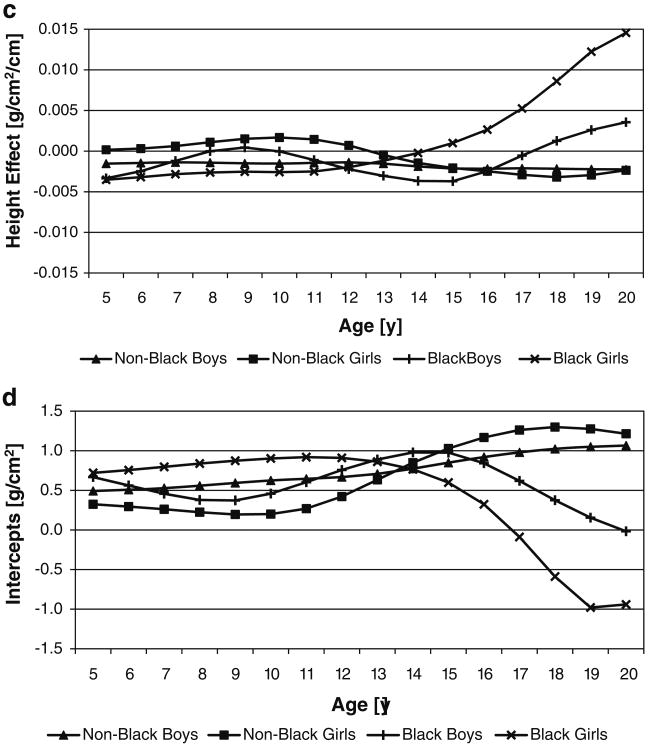
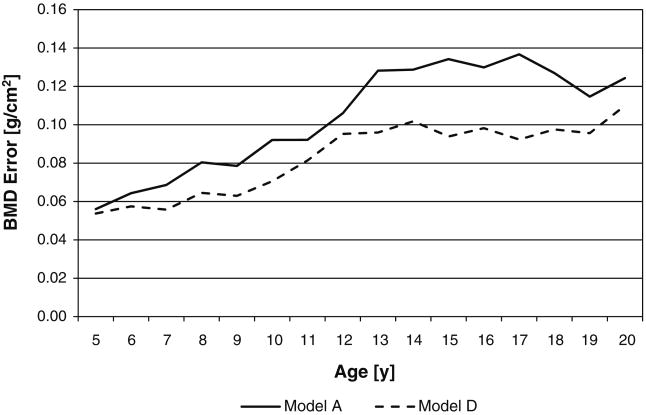
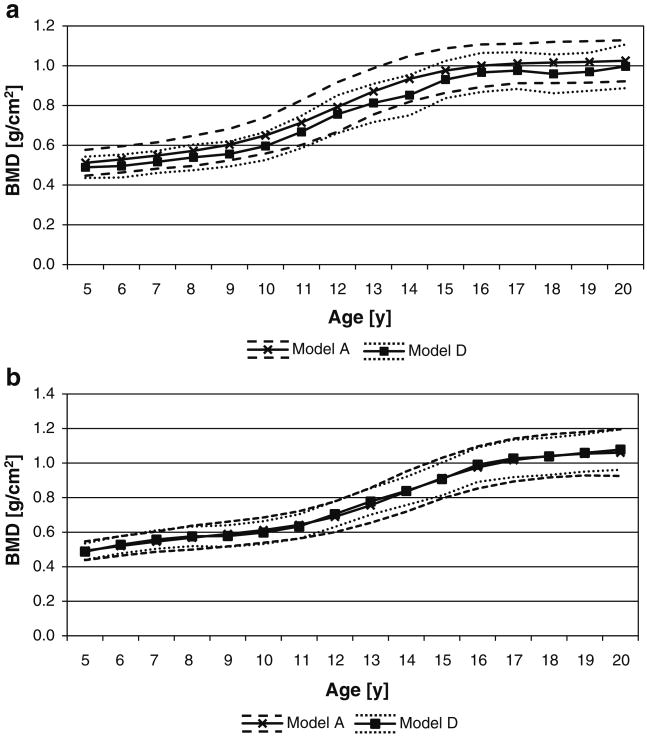
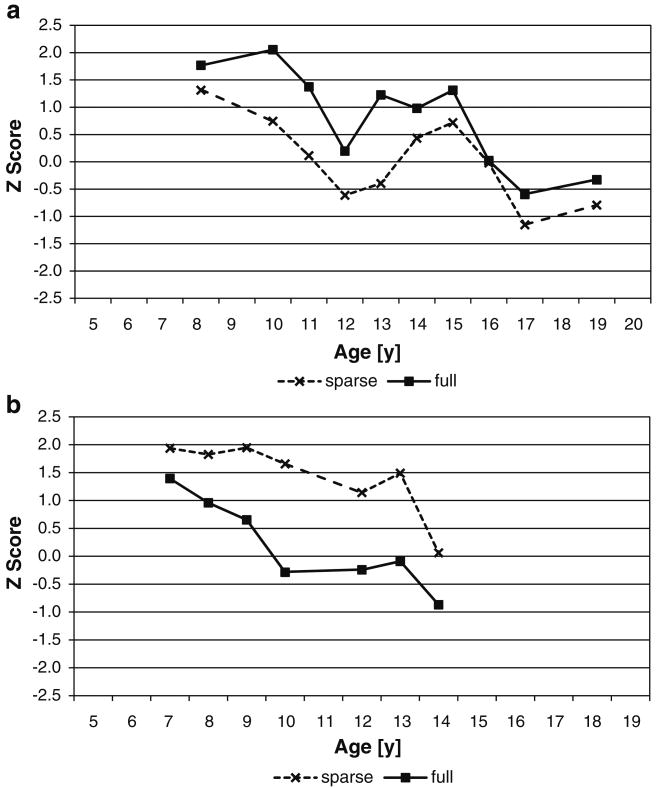
Results: This model provides narrower distributions and slight shifts of BMD values compared to the traditional model, which includes only age, gender, and race. Thus, the proposed model might constitute a better comparative standard for a specific child with given anthropometric values and should be less dependent on the anthropometric characteristics of the cohort used to devise the model.
Conclusions: The inclusion of multiple explanatory variables in the model, while creating smooth output curves, makes the MS(2) method attractive in modeling practically sized data sets. The clinical use of this model by the bone research community has yet to be fully established.
Conflict of interest statement
Figures
References
-
- Peck W. Consensus development conference: diagnosis, prophylaxis, and treatment of osteoporosis. Am J Med. 1993;94:646–650. - PubMed
-
- Matkovic V, Illich J, Skugor M. Calcium intake and skeletal formation. In: Burckhardt P, Heaney R, editors. Nutritional aspects of osteoporosis '94. Rome: Ares-Serono Symposia; 1995. pp. 129–145.
-
- Farhat G, Yamout B, Mikati MA, Demirjian S, Sawaya R, El-Hajj Fuleihan G. Effect of antiepileptic drugs on bone density in ambulatory patients. Neurology. 2002;58:1348–1353. - PubMed
-
- Henderson C, Specker B, Sierra R, Campaigne B, Lovell D. Total body bone mineral content in non-corticosteroid-treated postpubertal females with juvenile rheumatoid arthritis: frequency of osteopenia and contributing factors. Arthritis Rheum. 2000;43:531–540. - PubMed
-
- Gordan C, Bachrach L, Carpenter T, Crabtree N, et al. Dual energy x-ray absorptiometry interpretation and reporting in children and adolescents: the 2007 ISCD pediatric official positions. J Clin Densitom. 2008;11:43–58. - PubMed
Publication types
MeSH terms
Grants and funding
LinkOut - more resources
Full Text Sources
Medical
