

Mercury concentrations in lentic fish populations related to ecosystem and watershed characteristics
- PMID: 20496648
- PMCID: PMC3357655
- DOI: 10.1007/s13280-009-0001-z
Mercury concentrations in lentic fish populations related to ecosystem and watershed characteristics
Abstract
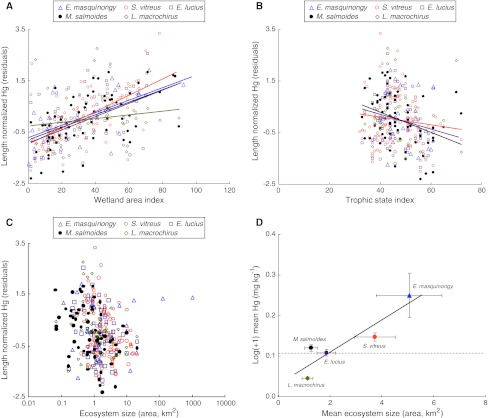
Predicting mercury (Hg) concentrations of fishes at large spatial scales is a fundamental environmental challenge with the potential to improve human health. In this study, mercury concentrations were examined for five species across 161 lakes and ecosystem, and watershed parameters were investigated as explanatory variables in statistical models. For all species, Hg concentrations were significantly, positively related to wetland coverage. For three species (largemouth bass, pike, and walleye), Hg concentrations were significantly, negatively related to lake trophic state index (TSI), suggestive of growth biodilution. There were no significant relationships between ecosystem size and mercury concentrations. However, Hg concentrations were strongly, positively related to ecosystem size across species. Scores of small or remote lakes that have never been tested could be prioritized for testing using models akin to those presented in this article. Such an approach could also be useful for exploring how Hg concentrations of fishes might respond to natural or anthropogenic changes to ecosystems over time.
Figures
Similar articles
-
Mercury speciation and biomagnification in the food web of Caddo Lake, Texas and Louisiana, USA, a subtropical freshwater ecosystem.Environ Toxicol Chem. 2011 May;30(5):1153-62. doi: 10.1002/etc.477. Epub 2011 Mar 4. Environ Toxicol Chem. 2011. PMID: 21305578
-
Climate and Physiography Predict Mercury Concentrations in Game Fish Species in Quebec Lakes Better than Anthropogenic Disturbances.Arch Environ Contam Toxicol. 2016 May;70(4):710-23. doi: 10.1007/s00244-016-0261-0. Epub 2016 Jan 29. Arch Environ Contam Toxicol. 2016. PMID: 26825460
-
Spatiotemporal trends in fish mercury from a mine-dominated ecosystem: Clear Lake, California.Ecol Appl. 2008 Dec;18(8 Suppl):A177-95. doi: 10.1890/06-1900.1. Ecol Appl. 2008. PMID: 19475924
-
A review of mercury concentrations in freshwater fishes of Africa: patterns and predictors.Environ Toxicol Chem. 2015 Feb;34(2):215-23. doi: 10.1002/etc.2818. Epub 2014 Dec 31. Environ Toxicol Chem. 2015. PMID: 25470784 Review.
-
Mercury sources, contaminations, mercury cycle, detection and treatment techniques: A review.Chemosphere. 2023 Jan;312(Pt 1):137314. doi: 10.1016/j.chemosphere.2022.137314. Epub 2022 Nov 18. Chemosphere. 2023. PMID: 36410499 Review.
Cited by
-
Factors influencing fish mercury concentrations in Iowa rivers.Ecotoxicology. 2019 Mar;28(2):229-241. doi: 10.1007/s10646-019-02017-1. Epub 2019 Jan 21. Ecotoxicology. 2019. PMID: 30666495
-
Heavy metals and minerals contents in pikeperch (Sander lucioperca), carp (Cyprinus carpio) and flathead grey mullet (Mugil cephalus) from Sidi Salem Reservoir (Tunisia): health risk assessment related to fish consumption.Environ Sci Pollut Res Int. 2017 Aug;24(24):19494-19507. doi: 10.1007/s11356-017-9586-0. Epub 2017 Jul 5. Environ Sci Pollut Res Int. 2017. PMID: 28677042
-
Effects of habitat on mercury concentrations in fish: a case study of Nile perch (Lates niloticus) in Lake Nabugabo, Uganda.Ecotoxicology. 2016 Jan;25(1):178-91. doi: 10.1007/s10646-015-1578-6. Epub 2015 Oct 31. Ecotoxicology. 2016. PMID: 26520435
-
Mercury and Arctic Char Gill Microbiota Correlation in Canadian Arctic Communities.Microorganisms. 2024 Nov 28;12(12):2449. doi: 10.3390/microorganisms12122449. Microorganisms. 2024. PMID: 39770652 Free PMC article.
References
-
- Björklund I, Borg H, Johansson K. Mercury in Swedish lakes—Its regional distribution and causes. AMBIO. 1984;13:118–121.
-
- Bonzongo JCJ, Lyons WB. Impact of land use and physicochemical settings on aqueous methylmercury levels in the Mobile-Alabama River System. AMBIO. 2004;33:328–333. - PubMed
-
- Drevnick PE, Canfield DE, Gorski PR, Shinneman ALC, Engstrom DR, Muir DCG, Smith GR, Garrison PJ, Cleckner LB, Hurley JP, Noble RB, Otter RR, Oris JT. Deposition and cycling of sulfur controls mercury accumulation in Isle Royale fish. Environmental Science and Technology. 2007;41:7266–7272. doi: 10.1021/es0712322. - DOI - PubMed
MeSH terms
Substances
LinkOut - more resources
Full Text Sources
Medical
