Review
. 2010 Sep 1;11(6):555-71.
doi: 10.2174/138920110792246555.

Recent development in PET instrumentation

Affiliations
Review

Recent development in PET instrumentation

By Hao Peng et al. Curr Pharm Biotechnol. .

Abstract

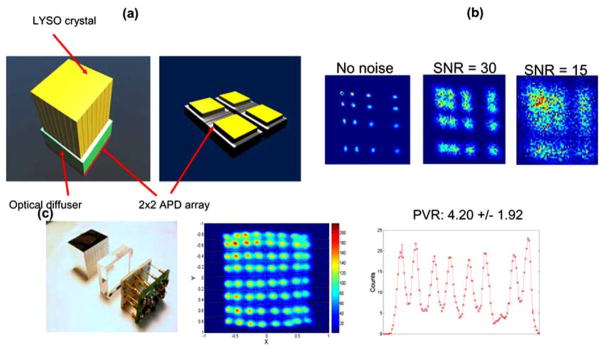
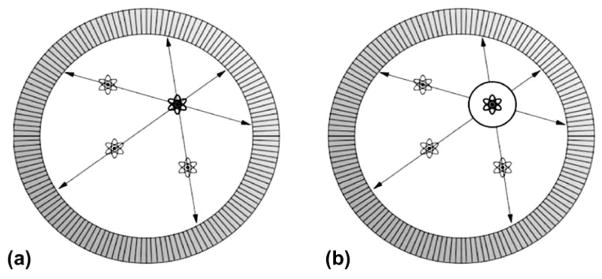
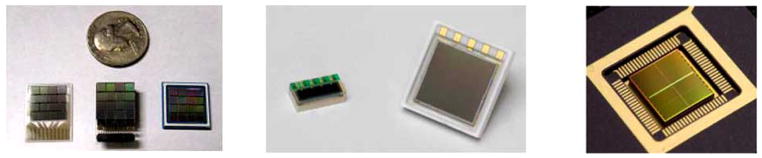
Positron emission tomography (PET) is used in the clinic and in vivo small animal research to study molecular processes associated with diseases such as cancer, heart disease, and neurological disorders, and to guide the discovery and development of new treatments. This paper reviews current challenges of advancing PET technology and some of newly developed PET detectors and systems. The paper focuses on four aspects of PET instrumentation: high photon detection sensitivity; improved spatial resolution; depth-of-interaction (DOI) resolution and time-of-flight (TOF). Improved system geometry, novel non-scintillator based detectors, and tapered scintillation crystal arrays are able to enhance the photon detection sensitivity of a PET system. Several challenges for achieving high resolution with standard scintillator-based PET detectors are discussed. Novel detectors with 3-D positioning capability have great potential to be deployed in PET for achieving spatial resolution better than 1 mm, such as cadmium-zinc-telluride (CZT) and position-sensitive avalanche photodiodes (PSAPDs). DOI capability enables a PET system to mitigate parallax error and achieve uniform spatial resolution across the field-of-view (FOV). Six common DOI designs, as well as advantages and limitations of each design, are discussed. The availability of fast scintillation crystals such as LaBr(3), and the silicon photomultiplier (SiPM) greatly advances TOF-PET development. Recent instrumentation and initial results of clinical trials are briefly presented. If successful, these technology advances, together with new probe molecules, will substantially enhance the molecular sensitivity of PET and thus increase its role in preclinical and clinical research as well as evaluating and managing disease in the clinic.


Figures

Fig. (1)
Fig. (1)
(a) Illustration of a dual panel CZT-based PET system for breast cancer imaging. Each panel has dimensions of 4×12×15 cm3. Each detector module has dimensions of 4×4×0.5 cm3 with 25-μm inter-module spacing, giving a packing fraction of over 99%.) The cross-strip readout scheme for CZT detectors with sets of parallel anode and cathode strips is deployed in order to limit the number of electronic readout channels. The anode and cathode electrodes can have different widths depending on resolution requirements. (b) Illustration of a box-shape CZT-based small animal PET system of 8×8×8 cm3 field-of-view. (Adapted from [30, 31, 33].
Fig. (2)
Fig. (2)
(a) The concept of using tapered crystals for small animal PET systems to reduce the dead area in between detector modules (assuming a bore of 10 cm diameter, each detector module has a cross-section area of 1×1 cm2 and crystals of 2 cm length). (b) Photograph of a tapered LSO array next to a rectangular LSO array and illustration of the dimensions of the simulated tapered LSO array. Note that there is no tapering along the axial direction. Adapted from [32].
Fig. (3)
Fig. (3)
Monte Carlo simulation of light collection efficiency from the ends of (a) 2×2×10 mm3 and (b) 1×1×10 mm3 crystal rod elements for different scintillation crystal materials and two different surface treatments. The “polished” treatment is the ideal perfectly specular surface, which cannot be accomplished in practice, so the corresponding data represent a light collection efficiency upper limit for the common scintillator readout configuration. The “ground” or “polished” surfaces are applied to all surfaces except that coupled to the photodetector. “Ground” and “polished” surfaces means diffuse and spectral, respectively, with respect to light ray reflections. Note that going from 2×2 to 1×1 mm2 crystal cross section significantly compromise light collection efficiency. Adapted from [39].
Fig. (4)
Fig. (4)
(a) Photograph of a 20×30 array of 0.43 mm pitch and the resulting flood histogram. The array was readout by a Hamamatsu H7546 MCPMT which has 64 individual channels arranged in an 8×8 grid (grid pitch: 2.25 mm). Signals from 8×8 cross strips were multiplexed through a charge division resistor network into 4 position-encoding signals, which were used to implement Anger logic positioning (see the formula shown in figure 4b). Significant crystal overlapping in the flood map is noticed. (b) Crystal flood maps for two high resolution arrays readout by position sensitive APDs (PSAPDs). Four spatial channels at four corners of each PSAPD were used to position events using Anger logic. The device has an effective area of 1.0×1.0 cm2 and was cooled to −10°C to improve the detector SNR and crystal separation. The 1D horizontal profile and the average peak-to-valley ratios (PVR) are shown for the flood maps obtained with cooling. Adapted from [37, 45].
Fig. (5)
Fig. (5)
(a) An Anger-logic PET block detector based on light multiplexing. A 2×2 array of large-area high gain APDs were used. (b) Simulated flood maps with different detector SNRs. Only one quadrant for the 8×8 array was simulated due to the symmetry. Significant degradation of the flood maps is observed as the SNR decreases. SNR refers to the ratio of the amplitude of 511 keV photopeak over the RMS noise of the detector when a single crystal is coupled directly to the photodetector. (c) The block detector prototype comprising the LYSO array (crystal dimensions: 2.75×3.0×20.0 mm3), the optical diffuser (9 mm thickness), the APD array and highly compact custom readout electronics. The crystal flood map and 1D profile for peak-to-valley ratio (PVR) analysis are shown. Adapted from [51].
Fig. (6)
Fig. (6)
(a) Picture of a 4×4×0.5 cm3 cross-strip CZT array. For PET, CZT slabs can be configured in the edge-on mode (see Fig. 1) or several slabs can be stacked together in the face-on mode to achieve high stopping power for 511 keV photons. (b) A typical energy spectrum of CZT detector irradiated by 511 keV photons. Energy resolution of 3% FWHM at 511 keV is far superior to that achieved in LSO-based scintillation detectors (~12%), though CZT has relatively poor time resolution. (c) The illustration of 3-D positioning for a cross-trip CZT detector. The C/A ratio (the amplitude of cathode signal over the amplitude of anode signal), and the timing difference between the anode and cathode signals, can be used to determine the interaction position in the direction orthogonal to the electrode planes. These quantities are plotted as a function of collimated beam position between the anode and cathode planes. The error bars denote the extent of the standard deviation for each data point. The width of the collimated photon beam is 1 mm. Adapted from [18, 30].
Fig. (7)
Fig. (7)
(a) Picture of an edge-on LYSO+PSAPD module designed for breast PET, including scintillation crystals, extra thin PSAPD modules and flex circuit. Each layer comprises two 200 μm thick PSAPD chips mounted on a 50 μm thick flex circuit. The flex circuit delivers bias to each PSAPD and enables readout of the four corner signals for positioning. (b) Picture of the thin module with two PSAPD chips mounted. Each dual-LYSO-PSAPD detector layer is oriented edge-on so that incoming photons encounter a minimum of ~2 cm thick of LSO with directly measured photon interaction depth (~ 1 mm). (c) The crystal flood map of an 8×8 array of 1×1×1 mm3 LYSO crystals without cooling. Adapted from [49].
Fig. (8)
Fig. (8)
(a) Illustration of DOI effect on the spatial resolution. For a brain-dedicated PET system of 36 cm diameter bore and crystal length of 20 mm, the intrinsic spatial resolution was studied with a point source shifting from the origin to the edge of FOV. Filtered-back-projection (FBP) was used and for each image, the FWHM of the intensity profile across the point source was analyzed. d1 and d2 are the thickness of the front and back crystal layer, respectively. (b) A configuration between 5/15 (d1/d2) and 10/10 mm is expected to provide the optimum DOI design for achieving uniform spatial resolution across the FOV. The configuration of 0/20 mm implies that only one crystal layer exists. (c) For the breast-dedicated PET system made of CZT detectors (see figure 1a), reconstructed image slices with different DOI resolutions (0, 2, 5 and 10 mm). The simulated spheres of 2 mm diameter are located within a XY plane at the center of the dual-panel system (Z=0). (d) The reconstructed orthogonal-plane (perpendicular to panels) sphere FWHM as a function of DOI resolution. Adapted from [33].
Fig. (9)
Fig. (9)
Illustration of several DOI design concepts for PET. (a) Dual crystal-photodetector(s) layers. (b) Single crystal layer with photodetectors at each end. (c) Phoswich design with two types of scintillation materials. (d) Statistical positioning with a monolithic crystal block. (e) Dual layer crystals with offset positions. (f) Dual layer crystals of mixed shapes.
Fig. (10)
Fig. (10)
(a) DOI design using two layers comprising triangular (TRI) and rectangular (RECT) crystal elements. Each module consists of four triangular crystals (top layer) and four rectangular crystals (bottom layer). The two layers produce different light profiles onto the photodetectors and they are coupled using optical grease or epoxy. The picture of individual crystal segments is shown. (b) The flood histograms of a basic module (comprising 8 crystals) are shown for two configurations (rectangular crystals at the top layer or at the bottom layer). The basic module was readout by a 2×2 SiPM array (pixel size: ~3.0 mm) without multiplexing. The gain (in voltage) and the energy resolution FWHM at 511 keV were analyzed after the individual crystals were segmented from the flood histograms. No significant performance difference is observed between crystals in the two layers.
Fig. (11)
Fig. (11)
Illustration of TOF-PET. (a) In conventional PET, the source of the activity is localized to a LOR between a detector pair (i.e., two measured photons). (b) In TOF-PET, timing information is used to constrain the source of the activity to a segment of the LOR. Adapted from [78].
Fig. (12)
Fig. (12)
(left) Designs of 4 × 4 arrays of SiPM devices with ~3.0 mm pitch from SensL, including glass slide, three-sided buttable array and BGA packages. (middle) Designs of a 1 × 4 array (1 mm pixel pitch) and a 2×2 array (3 mm pixel pitch) of SiPM devices from Hamamatsu. (right) A digital SiPM device developed by Philips (a 2×2 array). Active area of each pixel is ~3.8×3.3 mm2. Signal from multiple micro-cells within a pixel are digitally added which reduces the dark count rate and improves SNR. Adapted from [–93, 96].

References

    1. Gambhir SS. Molecular imaging of cancer with positron emission tomography. Nat Rev Cancer. 2002;2:683–693. - PubMed
    1. Nestle U, Weber, Hentschel WM, Grosu AL. Biological imaging in radiation therapy: role of positron emission tomography. Phys Med Biol. 2009;54:R1–25. - PubMed
    1. Phelps ME. Positron emission tomography provides molecular imaging of biological processes. Proc Natl Acad Sci USA. 2000;97:9226–9233. - PMC - PubMed
    1. Rohren EM, Turkington TG, Coleman E. Clinical applications of PET in oncology. Radiology. 2004;231:305–332. - PubMed
    1. Ray P, Pimenta H, Paulmurugan R, Berger F, Phelps ME, Iyer M, Gambhir SS. Noninvasive quantitative imaging of protein-protein interactions in living subjects. Proc Nat Acad Sci USA. 2002;99(5):3105–3110. - PMC - PubMed

MeSH terms