. 2010 May 24:11:323.
doi: 10.1186/1471-2164-11-323.

Transcript profiling of two alfalfa genotypes with contrasting cell wall composition in stems using a cross-species platform: optimizing analysis by masking biased probes

Affiliations

Transcript profiling of two alfalfa genotypes with contrasting cell wall composition in stems using a cross-species platform: optimizing analysis by masking biased probes

S Samuel Yang et al. BMC Genomics. .

Abstract

Background: The GeneChip(R) Medicago Genome Array, developed for Medicago truncatula, is a suitable platform for transcript profiling in tetraploid alfalfa [Medicago sativa (L.) subsp. sativa]. However, previous research involving cross-species hybridization (CSH) has shown that sequence variation between two species can bias transcript profiling by decreasing sensitivity (number of expressed genes detected) and the accuracy of measuring fold-differences in gene expression.

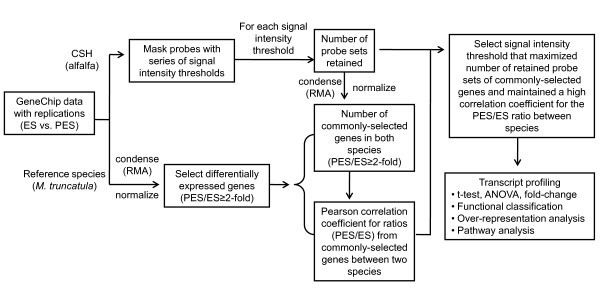
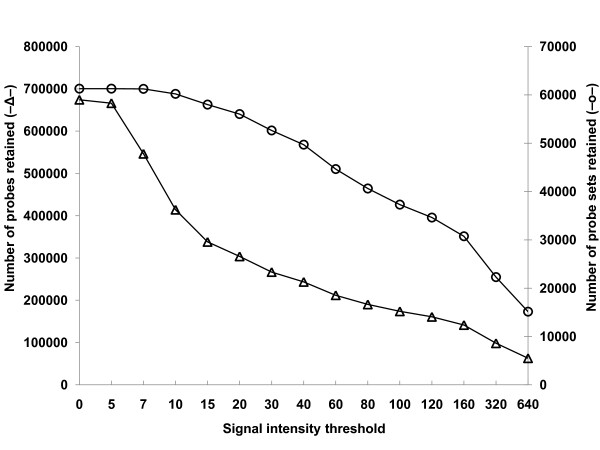
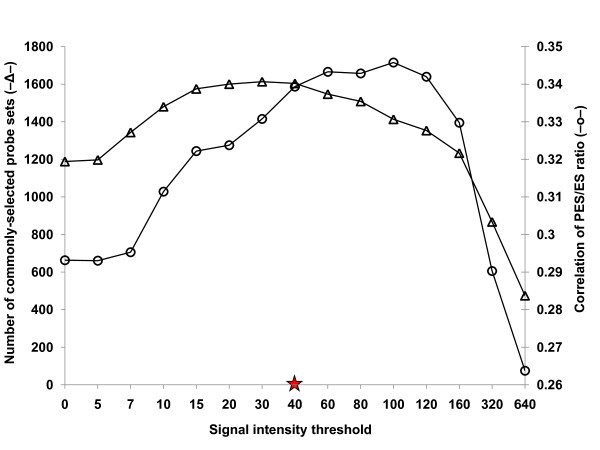
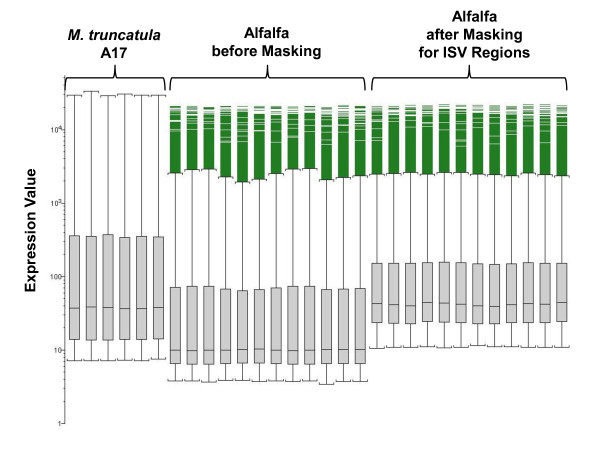
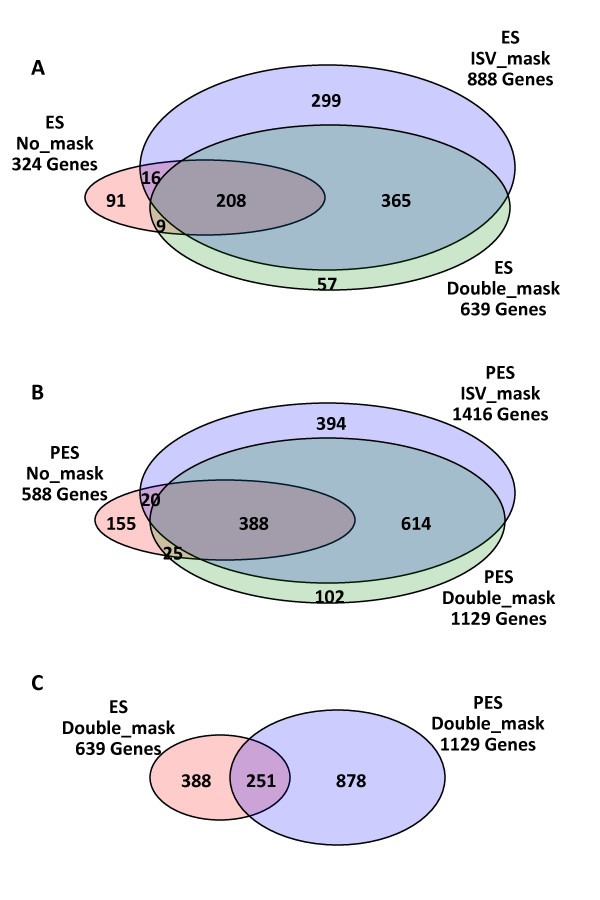
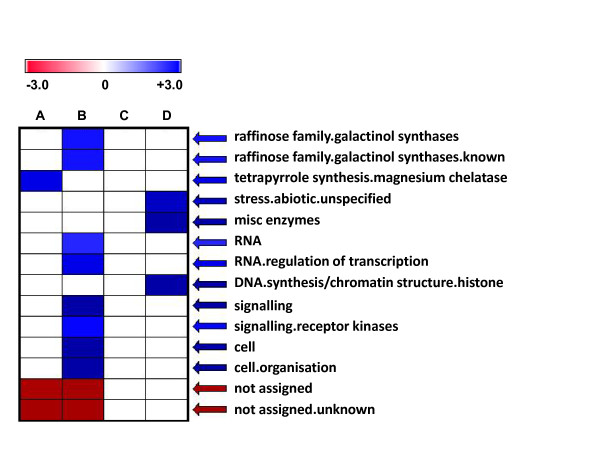
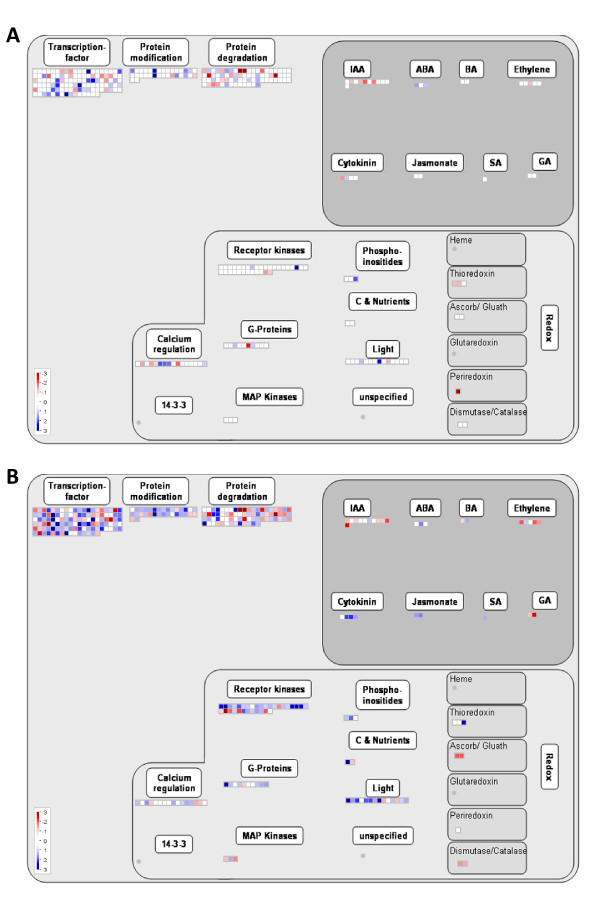
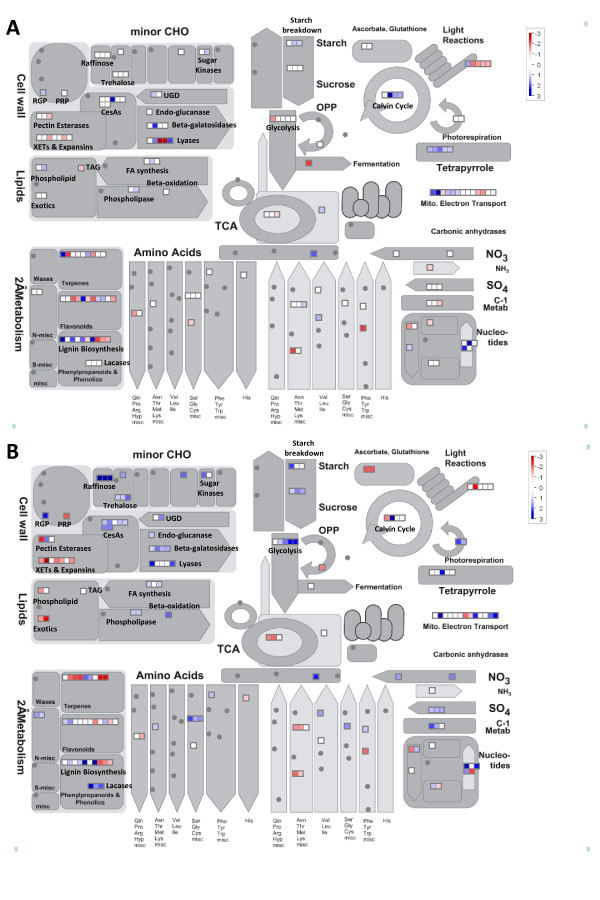
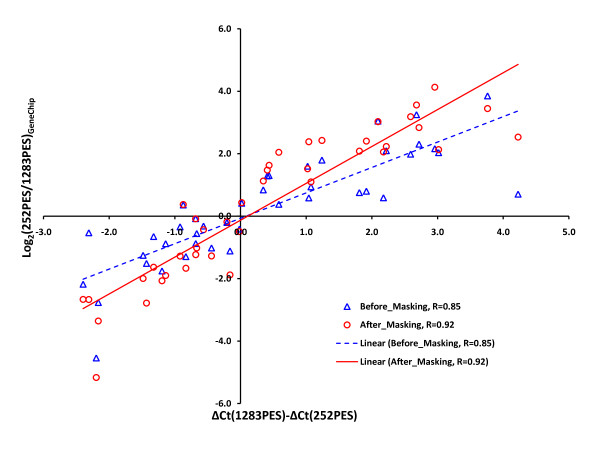
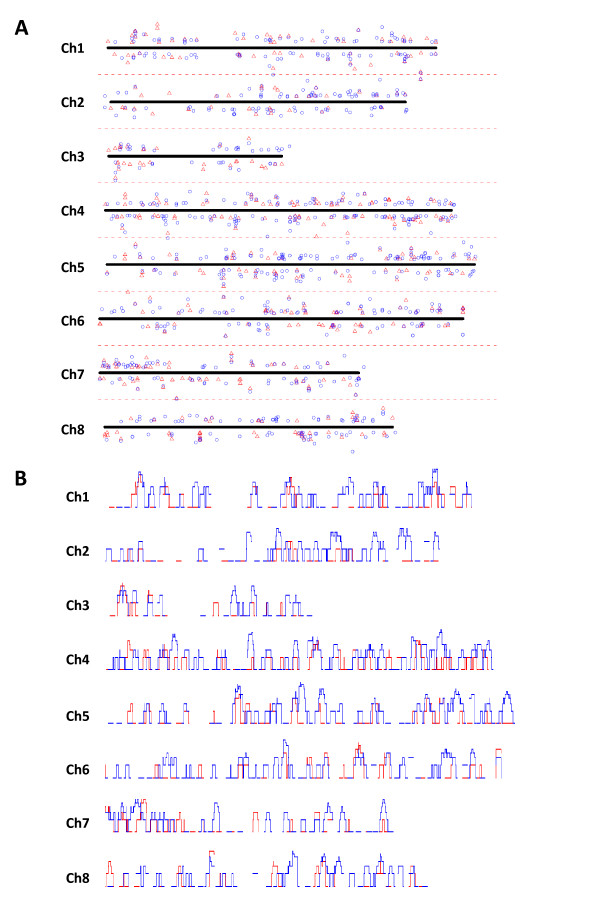
Results: Transcript profiling using the Medicago GeneChip(R) was conducted with elongating stem (ES) and post-elongation stem (PES) internodes from alfalfa genotypes 252 and 1283 that differ in stem cell wall concentrations of cellulose and lignin. A protocol was developed that masked probes targeting inter-species variable (ISV) regions of alfalfa transcripts. A probe signal intensity threshold was selected that optimized both sensitivity and accuracy. After masking for both ISV regions and previously identified single-feature polymorphisms (SFPs), the number of differentially expressed genes between the two genotypes in both ES and PES internodes was approximately 2-fold greater than the number detected prior to masking. Regulatory genes, including transcription factor and receptor kinase genes that may play a role in development of secondary xylem, were significantly over-represented among genes up-regulated in 252 PES internodes compared to 1283 PES internodes. Several cell wall-related genes were also up-regulated in genotype 252 PES internodes. Real-time quantitative RT-PCR of differentially expressed regulatory and cell wall-related genes demonstrated increased sensitivity and accuracy after masking for both ISV regions and SFPs. Over 1,000 genes that were differentially expressed in ES and PES internodes of genotypes 252 and 1283 were mapped onto putative orthologous loci on M. truncatula chromosomes. Clustering simulation analysis of the differentially expressed genes suggested co-expression of some neighbouring genes on Medicago chromosomes.

Conclusions: The problems associated with transcript profiling in alfalfa stems using the Medicago GeneChip as a CSH platform were mitigated by masking probes targeting ISV regions and SFPs. Using this masking protocol resulted in the identification of numerous candidate genes that may contribute to differences in cell wall concentration and composition of stems of two alfalfa genotypes.


Figures

Figure 1
Figure 1
Work-flow diagram for masking probes targeting ISV regions. Commonly-selected genes are defined as genes exhibiting at least a 2-fold difference in hybridization intensity expression ratio between PES and ES internodes (PES vs. ES, ≥2-fold difference) of both alfalfa and M. truncatula. RMA, Robust Multi-array Average; ES, elongating stem; PES, post-elongation stem; CSH, cross-species hybridization.
Figure 2
Figure 2
The number of probes (―Δ―) and probe sets (―O―) retained after masking probes with a series of signal intensity thresholds.
Figure 3
Figure 3
Effect of masking probes over a range of signal intensity thresholds (0-640) on the number of probe sets commonly-selected in M. truncatula and alfalfa (―Δ―) and the correlation of the PES/ES hybridization intensity ratio for the commonly-selected genes (―O―). A signal intensity threshold of 40 (red star) was selected to mask biased probes. Commonly-selected genes are defined as genes exhibiting at least a 2-fold difference in hybridization intensity expression ratio between PES and ES internodes (PES vs. ES, ≥ 2-fold difference) of both alfalfa and M. truncatula.
Figure 4
Figure 4
Box plots of 6 GeneChip data sets (two tissue types × 3 replications) from M. truncatula A17 genotype and 12 GeneChip datasets from alfalfa (2 genotypes × 2 tissue types × 3 replications) after masking for ISV regions (signal intensity threshold = 40)
Figure 5
Figure 5
Venn diagrams of the numbers of overlapping and non-overlapping genes differentially expressed between alfalfa genotypes 252 and 1283 in ES internodes (A) and PES internodes (B) before masking, after masking for ISV regions (threshold = 40), and after double-masking for ISV regions and SFPs, and (C) The number of overlapping and non-overlapping genes differentially expressed in ES and PES internodes of the two genotypes after double-masking. A total of 52,911 probe sets (Mtr and Msa probe sets only) out of the 61,103 probe sets in the GeneChip® Medicago Genome Array were used for analysis.
Figure 6
Figure 6
Over-representation analysis of gene functional classes that are differentially expressed in ES and PES internodes of alfalfa genotypes 252 and 1283. Columns: A, Genes up-regulated in 252 ES; B, Genes up-regulated in 252 PES; C, Genes down-regulated in 252 ES; D, Genes down-regulated in 252 PES compared to 1283 ES or PES. Blue and red indicate over- and under-representation of the corresponding class, respectively. The MapMan gene functional classification system consists of 34 major classes and their sub-classes [37]. The major classes (e.g., RNA) and their sub-classes (e.g., regulation of transcription) are separated by a "period" in the figure. The z-values for the functional class over- or under-represented in each group are provided in Additional file 2.
Figure 7
Figure 7
MapMan overview showing regulatory genes that are differentially expressed in alfalfa genotypes 252 and 1283 in ES (A) and PES (B) internodes. Individual genes are represented by small squares. The Log2(252/1283) values for the differentially expressed genes (p < 0.001, FDR < 0.05, ≥ 2-fold difference) were false color coded using a scale of -3 to +3. The intensity of blue and red colors indicates the degree of preferential expression of the corresponding genes in 252 and 1283, respectively. Color saturates at ±3 (8-fold difference or higher). See Methods for details. A complete list of the differentially expressed genes, corresponding MapMan functional categories, signal intensities and log ratios are provided in Additional file 1.
Figure 8
Figure 8
MapMan overview of metabolism showing genes that are differentially expressed between alfalfa genotypes 252 and 1283 in ES (A) and PES (B) internodes. The Log2(252/1283) values for the differentially expressed genes (p < 0.001, FDR < 0.05, ≥ 2-fold difference) were false color coded using a scale of -3 to +3. The intensity of blue and red colors indicates the degree of preferential expression of the corresponding genes in 252 and 1283, respectively. Color saturates at ±3 (8-fold difference or higher). See Methods for details. A complete list of the differentially expressed genes, corresponding MapMan functional categories, signal intensities and log ratios are provided in Additional file 1.
Figure 9
Figure 9
ΔΔCT values obtained from the real-time quantitative RT-PCR data for the selected candidate genes (Table 1) plotted against log2(252PES/1283PES) hybridization intensity ratio values from the GeneChip data before (blue triangles) and after (red circles) masking.
Figure 10
Figure 10
(A) Physical mapping of differentially expressed genes (p < 0.001, FDR < 0.05, ≥ 2-fold difference) between alfalfa genotypes 252 and 1283 in ES internodes (red triangles) and PES internodes (blue circles) onto putative orthologous loci in the Medicago truncatula chromosomes 1 through 8 and (B) Comparison of the frequency distribution on Medicago chromosomes 1 through 8 for the genes differentially expressed between alfalfa genotypes 252 and 1283 in ES (red line) and PES (blue line) internodes. (A)The corresponding physical loci for genes are indicated on the solid line (x-axis) for each chromosome. The y- axis, indicated within the doted lines above and below the solid line, provides a measure of the Log2(252/1283) value for each gene [(Log2(252/1283) = 0 for solid line (x-axis)]. The symbols located above and below the zero center line represent genes up- and down-regulated in 252 compared to 1283 in ES (red triangles) and PES (blue circles) internodes, respectively. The vertical distance of each symbol from the zero center line indicates the degree of differential gene expression [Log2(252/1283)] for the corresponding genes on each chromosome. The orthologous loci of the genes selected on M. truncatula chromosomes are provided in Additional file 3. (B)The y-axis for each panel represents relative gene frequency in a 50 kb sliding window that reads gene frequency over 10 kb intervals.

References

    1. Michaud R, Lehman WF, Rumbaugh MD. Alfalfa and alfalfa improvement -- Agronomy Monograph no. 29. Madison, WI: ASA-CSSA-SSSA; 1988. World distribution and historical development; pp. 25–91.
    1. Samac DA, Jung H-JG, Lamb JFS. In: Alcoholic Fuels. Minteer SD, editor. Boca Raton, FL: CRC Press; 2006. Development of alfalfa (Medicago sativa L.) as a feedstock for production of ethanol and other bioproducts; pp. 79–98.
    1. National Agricultural Statistics Service. On-line resource. 2008. http://www.nass.usda.gov
    1. Russelle MP, Birr AS. Large-scale assessment of symbiotic dinitrogen fixation by crops: Soybean and alfalfa in the Mississippi river basin. Agron J. 2004;96:1754–1760.
    1. Angers DA. Changes in soil aggregation and organic carbon under corn and alfalfa. Soil Sci Soc Am J. 1992;56:1244–1249.

Publication types

MeSH terms