

Prior immunity helps to explain wave-like behaviour of pandemic influenza in 1918-9
- PMID: 20497585
- PMCID: PMC2891754
- DOI: 10.1186/1471-2334-10-128
Prior immunity helps to explain wave-like behaviour of pandemic influenza in 1918-9
Abstract
Background: The ecology of influenza may be more complex than is usually assumed. For example, despite multiple waves in the influenza pandemic of 1918-19, many people in urban locations were apparently unaffected. Were they unexposed, or protected by pre-existing cross-immunity in the first wave, by acquired immunity in later waves, or were their infections asymptomatic?
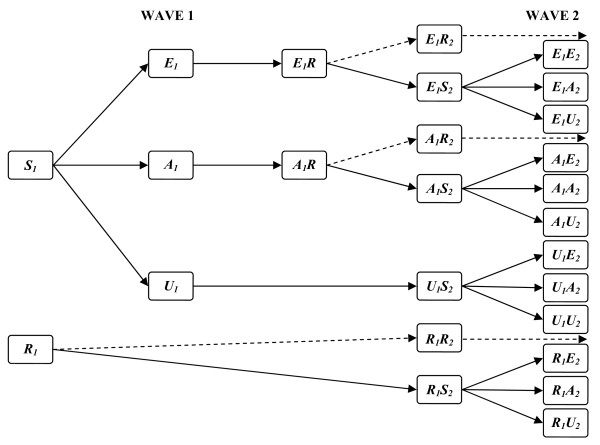
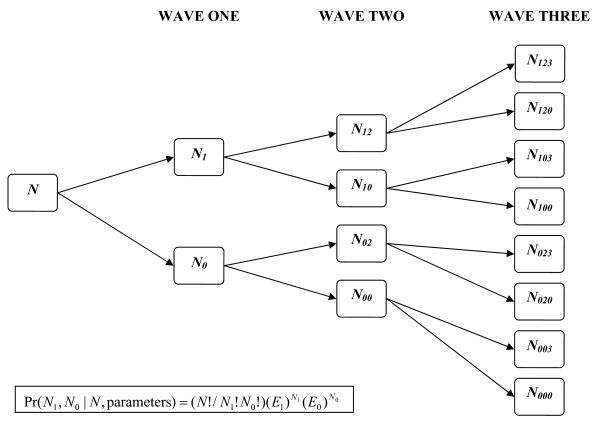
Methods: We modelled all these possibilities to estimate parameters to best explain patterns of repeat attacks in 24,706 individuals potentially exposed to summer, autumn and winter waves in 12 English populations during the 1918-9 pandemic.
Results: Before the summer wave, we estimated that only 52% of persons (95% credibility estimates 41-66%) were susceptible, with the remainder protected by prior immunity. Most people were exposed, as virus transmissibility was high with R0 credibility estimates of 3.10-6.74. Because of prior immunity, estimates of effective R at the start of the summer wave were lower at 1.57-3.96. Only 25-66% of exposed and susceptible persons reported symptoms. After each wave, 33-65% of protected persons became susceptible again before the next wave through waning immunity or antigenic drift. Estimated rates of prior immunity were less in younger populations (19-59%) than in adult populations (38-66%), and tended to lapse more frequently in the young (49-92%) than in adults (34-76%).
Conclusions: Our model for pandemic influenza in 1918-9 suggests that pre-existing immune protection, presumably induced by prior exposure to seasonal influenza, may have limited the pandemic attack-rate in urban populations, while the waning of that protection likely contributed to recurrence of pandemic waves in exposed cities. In contrast, in isolated populations, pandemic attack rates in 1918-9 were much higher than in cities, presumably because prior immunity was less in populations with infrequent prior exposure to seasonal influenza. Although these conclusions cannot be verified by direct measurements of historical immune mechanisms, our modelling inferences from 1918-9 suggest that the spread of the influenza A (H1N1) 2009 pandemic has also been limited by immunity from prior exposure to seasonal influenza. Components of that immunity, which are measurable, may be short-lived, and not necessarily correlated with levels of HI antibody.
Figures
Similar articles
-
Geography may explain adult mortality from the 1918-20 influenza pandemic.Epidemics. 2011 Mar;3(1):46-60. doi: 10.1016/j.epidem.2011.02.001. Epub 2011 Feb 21. Epidemics. 2011. PMID: 21420659
-
Mortality patterns associated with the 1918 influenza pandemic in Mexico: evidence for a spring herald wave and lack of preexisting immunity in older populations.J Infect Dis. 2010 Aug 15;202(4):567-75. doi: 10.1086/654897. J Infect Dis. 2010. PMID: 20594109 Free PMC article.
-
Planning for the next influenza H1N1 season: a modelling study.BMC Infect Dis. 2010 Oct 21;10:301. doi: 10.1186/1471-2334-10-301. BMC Infect Dis. 2010. PMID: 20964814 Free PMC article.
-
Understanding influenza transmission, immunity and pandemic threats.Influenza Other Respir Viruses. 2009 Jul;3(4):143-9. doi: 10.1111/j.1750-2659.2009.00089.x. Influenza Other Respir Viruses. 2009. PMID: 19627371 Free PMC article. Review.
-
A novel H1N1 virus causes the first pandemic of the 21st century.Eur J Immunol. 2009 Nov;39(11):2946-54. doi: 10.1002/eji.200939911. Eur J Immunol. 2009. PMID: 19790188 Review.
Cited by
-
Unchanged severity of influenza A(H1N1)pdm09 infection in children during first postpandemic season.Emerg Infect Dis. 2012 Nov;18(11):1755-62. doi: 10.3201/eid1811.120719. Emerg Infect Dis. 2012. PMID: 23092713 Free PMC article.
-
Immunity against heterosubtypic influenza virus induced by adenovirus and MVA expressing nucleoprotein and matrix protein-1.Sci Rep. 2013;3:1443. doi: 10.1038/srep01443. Sci Rep. 2013. PMID: 23485942 Free PMC article.
-
Age-Specific Excess Mortality Patterns During the 1918-1920 Influenza Pandemic in Madrid, Spain.Am J Epidemiol. 2018 Dec 1;187(12):2511-2523. doi: 10.1093/aje/kwy171. Am J Epidemiol. 2018. PMID: 30124746 Free PMC article.
-
Pre-existing immunity with high neutralizing activity to 2009 pandemic H1N1 influenza virus in Shanghai population.PLoS One. 2013;8(3):e58810. doi: 10.1371/journal.pone.0058810. Epub 2013 Mar 19. PLoS One. 2013. PMID: 23527030 Free PMC article.
-
How effective were Australian Quarantine Stations in mitigating transmission aboard ships during the influenza pandemic of 1918-19?PLoS Comput Biol. 2023 Nov 27;19(11):e1011656. doi: 10.1371/journal.pcbi.1011656. eCollection 2023 Nov. PLoS Comput Biol. 2023. PMID: 38011267 Free PMC article.
References
-
- Crosby A. America's Forgotten Pandemic. The influenza of 1918. Cambridge, UK: Cambridge University Press; 2003.
-
- London MoH. Pandemic of Influenza 1918-1919. In: HMSO, editor. Reports on Public Health and Medical Subjects. Vol. 4. London, England: Ministry of Health; 1920. p. 3.
Publication types
MeSH terms
LinkOut - more resources
Full Text Sources
Medical
