. 2010 Aug;116(2):477-87.
doi: 10.1093/toxsci/kfq156. Epub 2010 May 24.

Modeling the interaction of binary and ternary mixtures of estradiol with bisphenol A and bisphenol AF in an in vitro estrogen-mediated transcriptional activation assay (T47D-KBluc)

Affiliations

Modeling the interaction of binary and ternary mixtures of estradiol with bisphenol A and bisphenol AF in an in vitro estrogen-mediated transcriptional activation assay (T47D-KBluc)

Dieldrich S Bermudez et al. Toxicol Sci. 2010 Aug.

Abstract

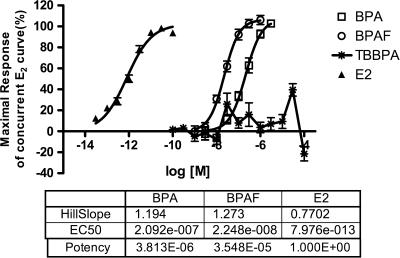
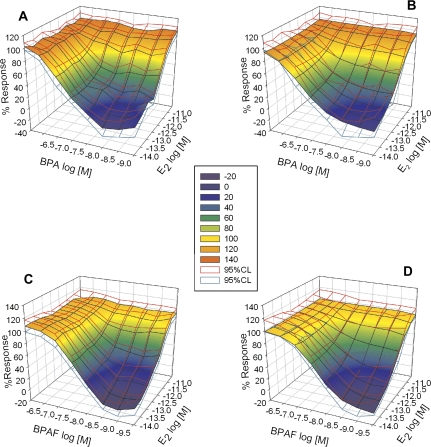
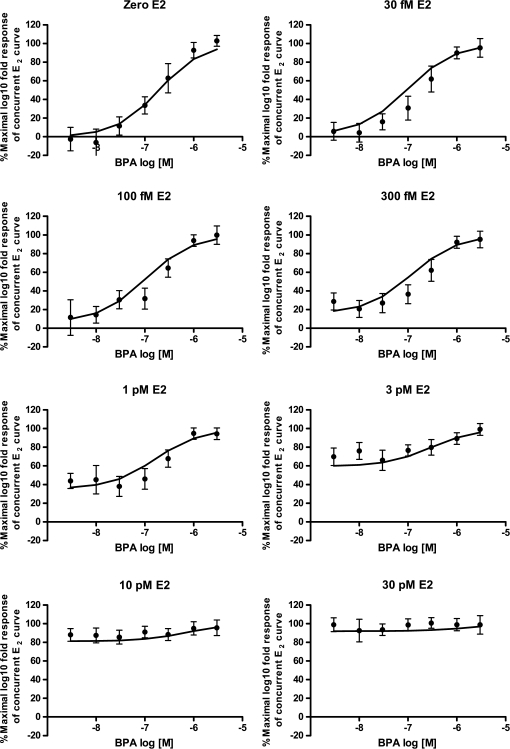
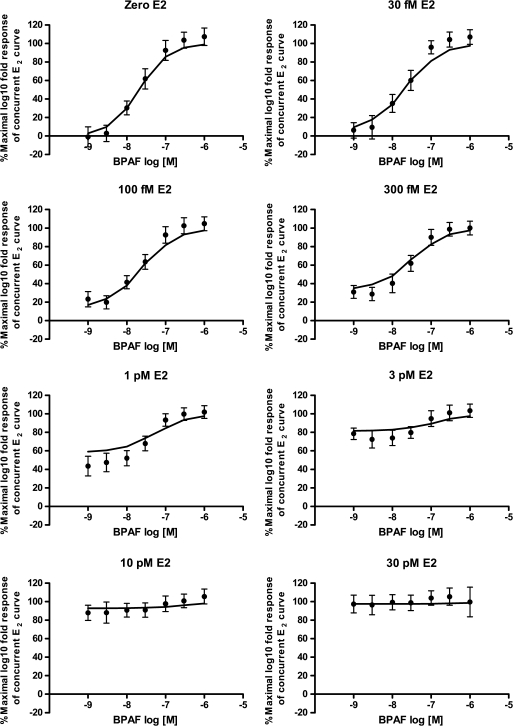
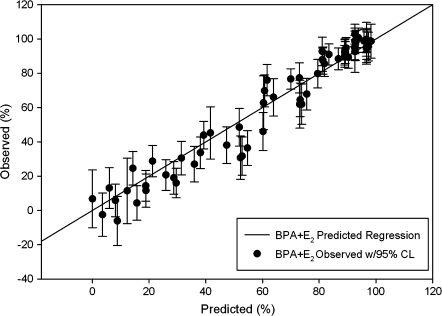
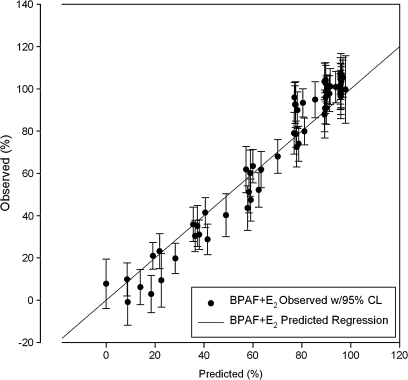
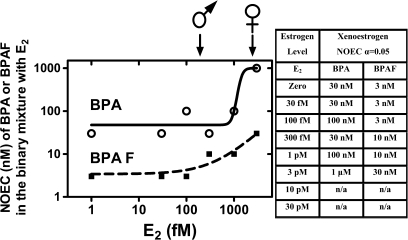
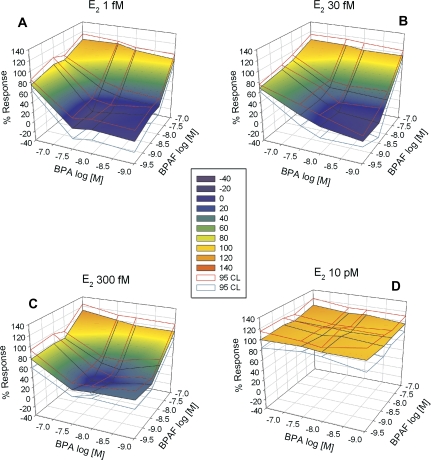
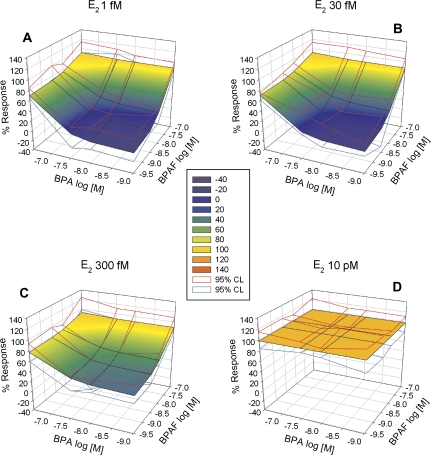
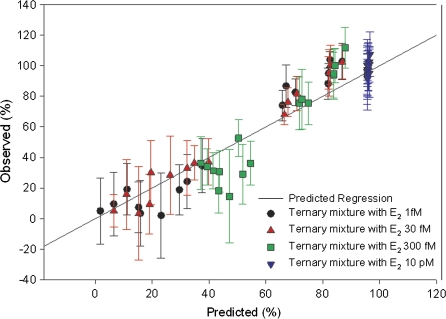
Exposure to xenoestrogens occurs against a backdrop to physiological levels of endogenous estrogens. Endogenous estrogen levels vary from low levels in early childhood to high levels during pregnancy and in young women. However, few studies have addressed how xenoestrogens interact with endogenous estrogens. The current study was designed to characterize the individual dose-response curves of estradiol-17beta (E(2)), bisphenol A (BPA), tetrabromo-bisphenol A (TBBPA), and bisphenol AF (BPAF, 4,4'-hexafluoroisopropylidene diphenol) on estrogen-dependent luciferase expression in T47D-KBluc cells and to determine how binary (8 x 8 factorial) and ternary (4 x 4 x 4 factorial) mixtures of an endogenous estrogen (E(2)) interact with BPA and/or BPAF. Log EC(50) and hillslope values with SEs, respectively, for individual compounds were as follows: E(2), -12.10M +/- 0.06071, 0.7702 +/- 0.1739; BPA, -6.679M +/- 0.08505, 1.194 +/- 0.2137; and BPAF, -7.648M +/- 0.05527, 1.273 +/- 0.1739. TBBPA was not evaluated in mixture studies because of its minimally estrogenic response at 3 x10(-5)M and elicited cytotoxicity at higher concentrations. Both the binary mixtures of E(2) with BPA and BPAF and the ternary mixture of E(2), BPA, and BPAF behaved in an additive manner. For binary mixtures, as E(2) concentration increased, higher concentrations of BPA and BPAF were necessary to induce a significant increase in the estrogenic response. Understanding the behavior of mixture interactions of xenoestrogens, like BPA and BPAF, with endogenous estrogens will allow a better assessment of the potential risk associated with exposure to these chemicals, individually or as mixtures.


Figures

FIG. 1.
FIG. 1.
T47D-KBluc assay ER transcriptional activation dose-response of individual chemicals, E2, BPA, BPAF, and TBBPA, fitted with a nonlinear regression (variable slope) curve. The EC50 and hillslope values were calculated through GraphPad Prism 5.01. Relative potency calculated by dividing EC50 values of individual compounds by E2 EC50 value. Data are plotted as mean ± SE. E2 n = 12; BPA n = 12; BPAF n = 15; TBBPA n = 15.
FIG. 2.
FIG. 2.
Predictions of dose-addition data generally fall within 95% CLs of the observed data. Observed (A and C) and dose-addition modeled data (B and D) compared with 95% CLs from observed data (red = upper CL, dark cyan = lower CL) for binary mixtures of BPA plus E2 (A and B) and BPAF plus E2 (C and D).
FIG. 3.
FIG. 3.
Predictions of dose-addition data generally fall within 95% CLs of the observed data. Binary mixture response of E2 and BPA, fitted with a nonlinear regression (variable slope) curve fit and 95% CLs. Line represents the predicted dose-addition model.
FIG. 4.
FIG. 4.
Predictions of dose-addition data generally fall within 95% CLs of the observed data. Binary mixture response of E2 and BPAF, fitted with a nonlinear regression (variable slope) curve fit and 95% CLs. Line represents the predicted dose-addition model.
FIG. 5.
FIG. 5.
Binary mixture of BPA plus E2 shows good correlation between predicted and observed data. Regression line plots the predicted EEQ of the binary mixtures for both axes x and y. Individual points plot the means with 95% CLs of observed results on the y-axis and predicted EEQ on the x-axis. The scatter allows for the evaluation of the efficacy of the EEQ model.
FIG. 6.
FIG. 6.
Binary mixture of BPAF plus E2 shows good correlation between predicted and observed data. Regression line plots the predicted EEQ of the binary mixtures for both axis x and y. Individual points plot the means with 95% CL of observed results on the y-axis and predicted EEQ on the x-axis. The scatter allows for the evaluation of the efficacy of the EEQ model.
FIG. 7.
FIG. 7.
The NOEC for E2 plus BPA or BPAF. The NOECs are for BPA or BPAF when combined with the stated concentrations of E2 and indicate which concentration of BPA or BPAF is necessary to induce a statistically significant response in the binary mixture. Increasing levels of BPA or BPAF are required to enhance the estrogenicity of the in vitro mixture as the E2 levels increase. Arrows indicate lowest measured E2 levels in humans and prepubertal boys and girls, respectively. T47D-KBluc assay reached saturation and maximal response was induced; hence, NOEC cannot be calculated; n/a, not applicable.
FIG. 8.
FIG. 8.
Observed ternary mixtures of BPA and BPAF plus E2 (A = 1fM, B = 30fM, C = 300fM, and D = 10pM) a with 95% CLs from observed data (red = upper CL, dark cyan = lower CL).
FIG. 9.
FIG. 9.
Predictions of dose-addition data generally fall within 95% CLs of the observed data. Dose-addition predictions for ternary mixtures of BPA and BPAF plus E2 (A = 1fM, B = 30fM, C = 300fM, and D = 10pM) a with 95% CLs from observed data (red = upper CL, dark cyan = lower CL).
FIG. 10.
FIG. 10.
Ternary mixture of BPA and BPAF plus E2 shows good correlation between predicted and observed data. Regression line plots the predicted EEQ of the ternary mixture for both axes x and y. Individual points plot the mean with 95% CLs of observed results on the y-axis and predicted EEQ on the x-axis. Black circles correspond to ternary mixtures with 1fM E2; red triangles correspond to ternary mixtures with 30fM E2; blue squares correspond to ternary mixtures with 300fM E2; and black cross with green lines correspond to ternary mixtures with 10pM E2. The scatter allows for the evaluation of the efficacy of the EEQ model.

References

    1. Akahori Y, Nakai M, Yamasaki K, Takatsuki M, Shimohigashi Y, Ohtaki M. Relationship between the results of in vitro receptor binding assay to human estrogen receptor alpha and in vivo uterotrophic assay: comparative study with 65 selected chemicals. Toxicol. In Vitro. 2008;22:225–231. - PubMed
    1. Aksglaede L, Juul A, Leffers H, Skakkebaek NE, Andersson AM. The sensitivity of the child to sex steroids: possible impact of exogenous estrogens. Hum. Reprod. Update. 2006;12:341–349. - PubMed
    1. Bay K, Andersson AM, Skakkebaek NE. Estradiol levels in prepubertal boys and girls—analytical challenges. Int. J. Androl. 2004;27:266–273. - PubMed
    1. Bhavsar SP, Reiner EJ, Hayton A, Fletcher R, MacPherson K. Converting toxic equivalents (TEQ) of dioxins and dioxin-like compounds in fish from one toxic equivalency factor (TEF) scheme to another. Environ. Int. 2008;34:915–921. - PubMed
    1. Center for the Evaluation of Risks to Human Reproduction (CERHR) NTP-CERHR Monograph on the Potential Human Reproductive and Developmental Effects of Bisphenol A. Research Triangle Park, NC: NIEHS; 2008. - PubMed

Publication types

MeSH terms