

Arrested phase separation in reproducing bacteria creates a generic route to pattern formation
- PMID: 20498087
- PMCID: PMC2900711
- DOI: 10.1073/pnas.1001994107
Arrested phase separation in reproducing bacteria creates a generic route to pattern formation
Abstract
We present a generic mechanism by which reproducing microorganisms, with a diffusivity that depends on the local population density, can form stable patterns. For instance, it is known that a decrease of bacterial motility with density can promote separation into bulk phases of two coexisting densities; this is opposed by the logistic law for birth and death that allows only a single uniform density to be stable. The result of this contest is an arrested nonequilibrium phase separation in which dense droplets or rings become separated by less dense regions, with a characteristic steady-state length scale. Cell division predominates in the dilute regions and cell death in the dense ones, with a continuous flux between these sustained by the diffusivity gradient. We formulate a mathematical model of this in a case involving run-and-tumble bacteria and make connections with a wider class of mechanisms for density-dependent motility. No chemotaxis is assumed in the model, yet it predicts the formation of patterns strikingly similar to some of those believed to result from chemotactic behavior.
Conflict of interest statement
The authors declare no conflict of interest.
Figures
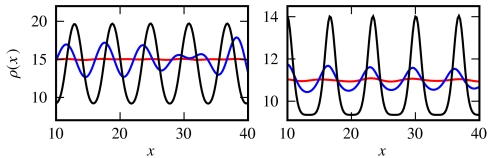
 ; times: 102, 103, 104). (Right) Subcritical case (α = κ = 0.005, λ = 0.02, ρ0 = 11,
  ; times: 3.102, 3.103, 105).
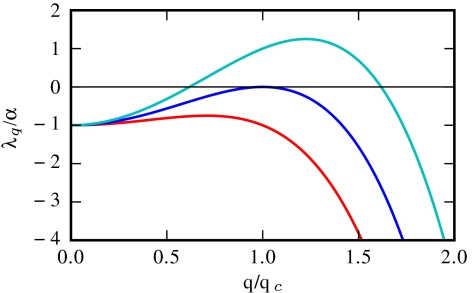
 , 2, 3 (from bottom to top). At the transition, only one critical mode q = qc is unstable.
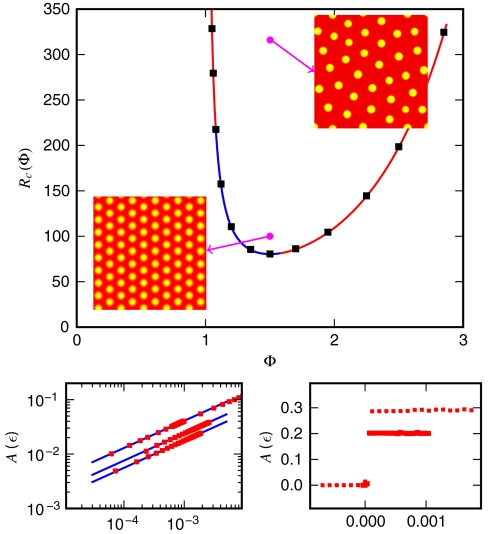
 , 0.12, 0.20, and 0.51. The color bar shows values of the dimensionless density u; see Eq. 5.
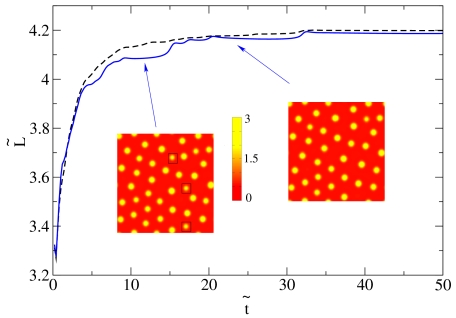
 , as a function of time,
  (both in dimensionless units), for a system in the inhomogeneous phase, with initially random density fluctuations around ρ0. Parameters were R ∼ 316 and Φ = 1.35, whereas the system size was 35.5 × 35.5 (in dimensionless units). The solid line corresponds to a single run, whereas the dashed line is an average over six runs. The steps in the single run curve correspond to evaporation-condensation events, highlighted by black squares in the snapshots shown in the figure (before and after one of the steps, respectively, arrows indicate positions on the plot corresponding to the two snapshots). The color bar shows values of the dimensionless density u.
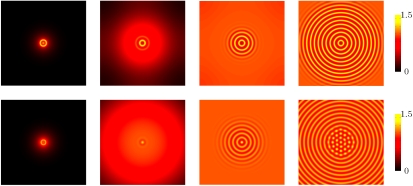
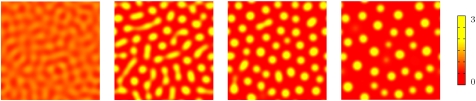
 , 5, 10, and 27. (Bottom) Breakage of rings into dots. The four snapshots correspond to the time evolution of a system with R = 100 and Φ = 1.3. We show a 125 × 125 fraction of the simulation box, with the boundaries far away and not affecting the pattern. The snapshots correspond to times equal to (from left to right)
  , 7, 29, and 122. For both rows, the color bar shows values of the dimensionless density u.
Comment in
-
Chemotactic patterns without chemotaxis.Proc Natl Acad Sci U S A. 2010 Jun 29;107(26):11653-4. doi: 10.1073/pnas.1006363107. Epub 2010 Jun 18. Proc Natl Acad Sci U S A. 2010. PMID: 20562344 Free PMC article. No abstract available.
References
-
- Shapiro JA. The significance of bacterial colony patterns. BioEssays. 1995;17:597–607. - PubMed
-
- Harshey RM. Bacterial motility on a surface: Many ways to a common goal. Annu Rev Microbiol. 2003;57:249–273. - PubMed
-
- Budrene EO, Berg HC. Complex patterns formed by motile cells of Escherichia coli. Nature. 1991;349:630–633. - PubMed
-
- Budrene EO, Berg HC. Dynamics of formation of symmetrical patterns by chemotactic bacteria. Nature. 1995;376:49–53. - PubMed
Publication types
MeSH terms
LinkOut - more resources
Full Text Sources
