. 2010 Jul 15;588(Pt 14):2589-604.
doi: 10.1113/jphysiol.2010.190066. Epub 2010 May 24.

Regulation of plasticity of glutamate synapses by endocannabinoids and the cyclic-AMP/protein kinase A pathway in midbrain dopamine neurons

Affiliations

Regulation of plasticity of glutamate synapses by endocannabinoids and the cyclic-AMP/protein kinase A pathway in midbrain dopamine neurons

Samir Haj-Dahmane et al. J Physiol. .

Abstract

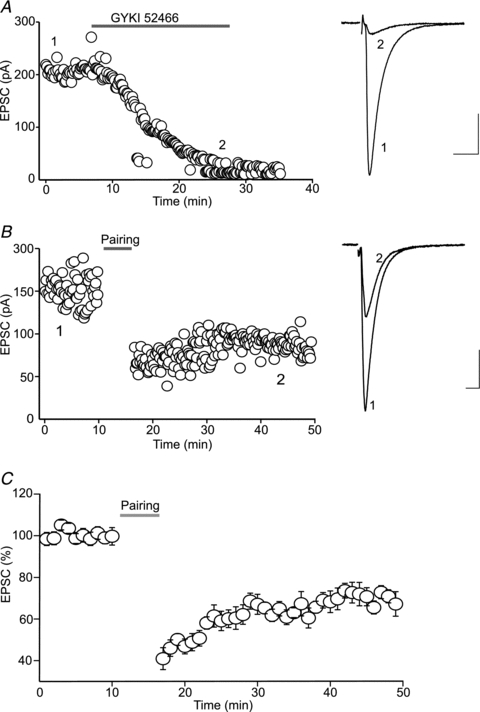
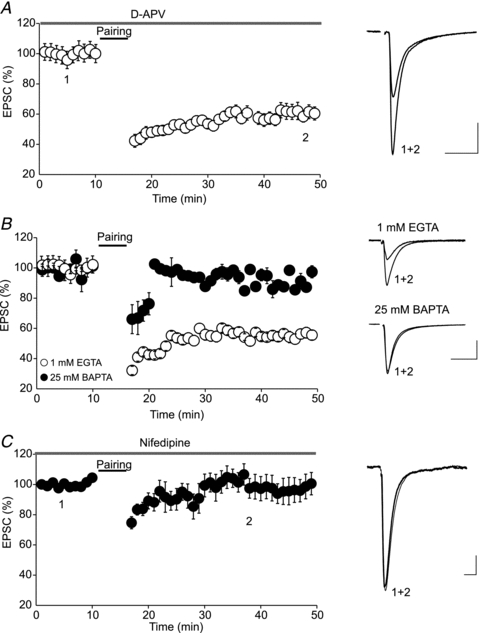
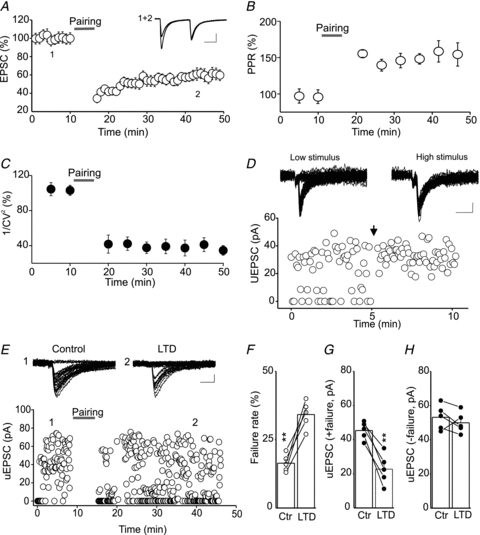
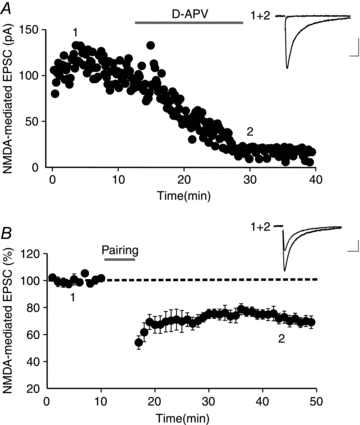
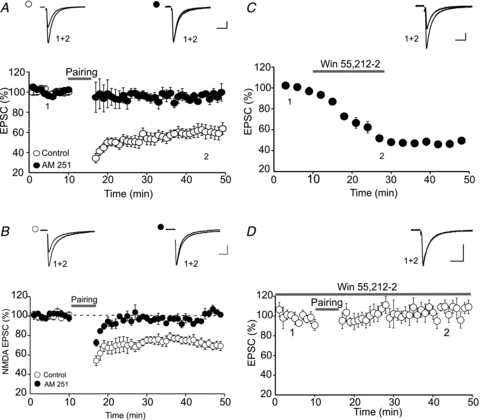
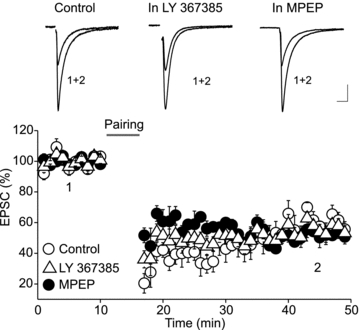
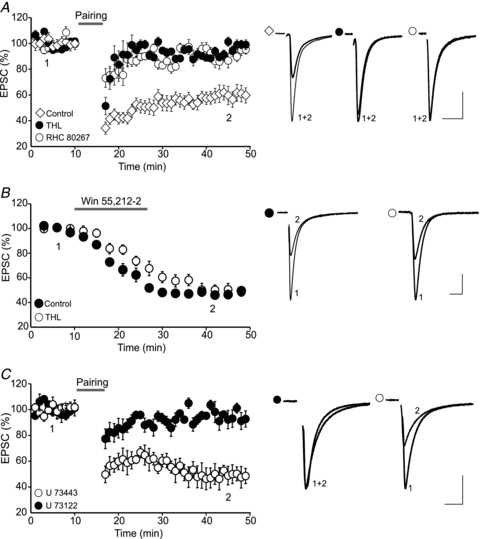
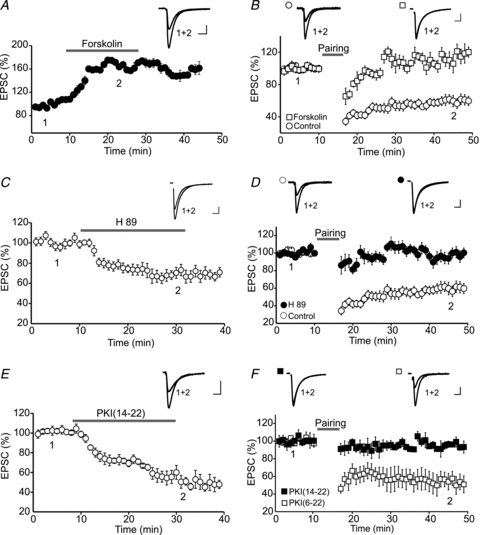
Endocannabinoids (eCBs) are lipid signalling molecules which play a key role in the regulation of synaptic transmission and plasticity in the central nervous system. Previous studies have reported that eCBs are released 'on demand' in the ventral tegmental area (VTA), a brain region critical for reward learning. However, their role in modulating the long-term plasticity of glutamate synapses of VTA dopamine (DA) neurons remains unknown. In the present study, we showed that low frequency afferent stimulation paired with moderate postsynaptic depolarization elicited an N-methyl-d-aspartate (NMDA) receptor-independent long-term depression (LTD) at glutamate synapses of VTA DA neurons. This form of LTD was caused by a decrease in the probability of glutamate release. Examination of the mechanisms underlying this form of LTD revealed that it was mediated by retrograde eCB signalling. In addition, we found that inhibition of 2-arachidonoyl glycerol biosynthesis blocked LTD induction, suggesting that 2-arachidonoyl glycerol is the most likely retrograde eCB messenger mediating LTD. The eCB-LTD induced at glutamate synapses of VTA DA neurons also required the inhibition of the presynaptic cAMP/PKA pathway. Taken together, these results reveal a critical role of eCBs in controlling the long-term plasticity of glutamate synapses in VTA DA neurons.


Figures

Figure 1
Figure 1. Low frequency afferent stimulation (LFS) paired with postsynaptic depolarization induces LTD of AMPAR-mediated EPSCs
A, effect of the selective AMPA receptor antagonist GYKI 52466 (50 μm) on EPSC amplitude recorded from a VTA neuron in the presence of the GABAA and glycine receptor antagonists picrotoxin (100 μm) and strychnine (20 μm), respectively. Right panel depicts averaged EPSC traces recorded before (1) and during (2) GYKI 52466 application. B, a representative experiment depicting LTD of AMPAR-EPSCs induced by pairing LFS with moderate membrane depolarization for 5 min. Right panel illustrates superimposed EPSCs (average of 30 trials) taken before (1) and 30 min after pairing (2). C, summary graph of the time course and magnitude of LTD (n = 20) induced in VTA neurons. Calibration bars for EPSC traces: 50 pA, 10 ms.
Figure 2
Figure 2. LTD induction is independent of NMDA receptor activation, but requires an increase in postsynaptic intracellular Ca2+
A, summary plot of LTD in VTA neurons induced in the presence of the NMDA receptor antagonist d-APV (50 μm). Blockade of NMDA receptors had no significant effects on the magnitude of LTD (n = 8, P > 0.05, compared to Fig. 1C). Right panel illustrates superimposed EPSCs (average of 30 trials) taken at the time points indicated on the left panel. B, chelating postsynaptic intracellular Ca2+ with BAPTA (25 mm) abolishes LTD. Left panel is a summary graph of LTD recorded using an internal solution containing either 1 mm EGTA (○, n = 9) or 25 mm BAPTA (•, n = 8). Right panel illustrates superimposed EPSCs recorded using either with 1 mm EGTA (upper traces) or 25 mm BAPTA (lower traces) and taken at time points indicated in the left panel. C, the L-type Ca2+ channel blocker nifedipine abolishes LTD. Left panel is a summary graph of LTD induced in the presence of nifedipine (30 μm, n = 5). The right panel depicts averaged EPSC traces taken before and after the pairing protocol, at the time points indicated by numbers on the left panel. Calibration bars for the EPSC traces: 50 pA, 10 ms.
Figure 3
Figure 3. LTD in VTA neurons is mediated by a decrease in glutamate release
A, LTD induced by a pairing protocol using pairs of afferent stimuli with 50 ms interstimulus interval (n = 10). Inset depicts superimposed EPSC traces (average of 30 trials) collected before (1) and 30 min after pairing (2). Calibration bars: 50 pA, 20 ms. B, LTD is accompanied by a persistent increase in the PPR (n = 10). C, LTD is associated with a decrease in 1/CV2 (n = 10). D, the EPSCs elicited by the ‘minimal stimulation’ protocol are unitary EPSCs (uEPSCs). Upper panel depicts superimposed uEPSC traces elicited by low (left traces) and high intensity stimuli (right traces). Lower panel represents the amplitude and failures of uEPSCs. An increase in the stimulus intensity at the time indicated by the arrow resulted in a shift from failures to consistent uEPSCs. Calibration bars: 10 pA, 10 ms. E, a representative experiment illustrating the effect of pairing using the ‘minimal stimulation’ protocol on the amplitude and failure rate of uEPSCs. Upper panel illustrates superimposed uEPSCs (30 trials) taken before (control) and 25 min after pairing (LTD). Calibration bars: 10 pA, 5 ms. F, summary bar graph of failure rate determined before (Ctr) and 25 min after pairing (LTD). Note that LTD is accompanied by a significant increase in failure rate (**P < 0.01, n = 5). G, average uEPSC amplitude including failure recorded before (Ctr) and 25 min after pairing (LTD). Pairing protocol induces a significant decrease in average amplitude of uEPSCs including failure (**P < 0.01, n = 5). H, summary graph of uEPSC amplitude excluding failure obtained before (Ctr) and 25 min after pairing (LTD). Pairing had no significant effects on the potency of AMPA receptors (P > 0.05, n = 5).
Figure 4
Figure 4. Pairing protocol induces LTD of NMDAR-EPSCs
A, NMDAR-EPSCs recorded from a VTA neuron voltage clamped at −60 mV in 0.1 mm MgCl2, picrotoxin (100 μm), strychnine (20 μm) and DNQX (50 μm). Inset depicts superimposed EPSC traces taken before (1) and during (2) d-APV (50 μm) application. B, summary graph of LTD of NMDAR-EPSCs induced by pairing protocol (n = 8). Inset illustrates superimposed EPSC traces taken before (1) and 25 min (2) after pairing. Calibration bars: 50 pA, 50 ms.
Figure 5
Figure 5. Retrograde eCB signalling mediates LTD at glutamate synapses of VTA neurons
A, the CB1 receptor antagonist AM 251 abolishes LTD of AMPAR-EPSCs. Upper panel depicts superimposed EPSCs (average of 30 trials) taken before and 30 min after pairing in the control condition (left traces) and in the presence of AM 251 (3 μm, right traces). Calibration bars: 50 pA, 10 ms. Lower panel is a summary graph of LTD induced in the absence (○, n = 8) and in the presence of AM 251 (•, n = 8). B, blockade of CB1 receptors abolishes LTD of NMDAR-EPSCs. Lower panel is a summary graph of LTD of NMDAR-EPSCs obtained in the absence (○, n = 5) and in the presence of AM 251 (•, n = 5). Upper panel depicts superimposed averaged NMDAR-EPSC traces recorded at the time points indicated by number in the lower panel. Calibration bars: 50 pA, 50 ms. C, activation of CB1 receptors inhibits the amplitude of EPSCs. Upper panel illustrates average EPSCs recorded before (1) and during (2) Win 55,212-2 (10 μm) application. Lower panel illustrates a summary graph of the depression of EPSC amplitude induced by Win 55,212-2 (10 μm, n = 7). D, summary graph illustrating the effect of pretreatment of slices with Win 55,212-2 (10 μm) on LTD induction. Note that pairing protocol failed to induce LTD in slices pretreated with Win 55,212-2. Calibration bars: 50 pA, 10 ms.
Figure 6
Figure 6. Activation of group I mGluRs is not required for the induction of eCB-LTD in VTA neurons
Upper panel depicts superimposed EPSC traces taken before and after pairing protocol in the control condition (left traces), in the presence of the selective mGluR1 receptor antagonist LY 367385 (100 μm; middle traces), and the mGluR5 receptor antagonist MPEP (10 μm, right traces). Lower panel is a summary graph of LTD induced in the control slices (○, n = 6), and in slices treated with LY 367385 (▵, n = 6), and MPEP (•, n = 4). Note that the blockade of group I mGluRs had no significant effects on the LTD. Calibration bars: 50 pA, 10 ms.
Figure 7
Figure 7. Blocking DGL and PLC pathways abolishes eCB-LTD
A, inhibition of DGL with THL and RHC 80267 blocks LTD. Left panel illustrates a summary graph of LTD induced in control slices (◊, n = 8), in slices pretreated with THL (3 μm, •, n = 6), and slices pretreated with RHC 80267 (10 μm, ○, n = 7). Right panel depicts superimposed averaged EPSC traces from representative neurons taken at time points indicated by numbers in the left panel in the control condition, in the presence of THL, and in the presence of RHC 80267. B, inhibition of DGL has no effect on the Win 55,212-2-induced inhibition of EPSCs. Left panel is a summary graph of the effect of Win 55,212-2 (10 μm) on the amplitude of EPSCs obtained in control slices (•, n = 8) and in slices treated with THL (○, n = 5). Right panel depicts EPSC traces from representative neurons taken at time points indicated in the left panel. C, inhibition of PLC abolishes LTD. Left panel depict a summary graph of LTD induced in slices treated with the PLC inhibitor, U 73122 (10 μm, •, n = 6) or its inactive analogue, U 73443 (10 μm, ○, n = 6). Right panel depicts superimposed EPSCs traces taken at time points indicated by numbers in the left panel. Calibration bars: 50 pA, 10 ms.
Figure 8
Figure 8. Inhibition of the cAMP/PKA pathway is required for eCB-LTD in VTA neurons
A, forskolin increases the amplitude of EPSCs. Lower panel is a summary graph of the effect of forskolin (10 μm) on the amplitude of EPSCs. Inset depicts superimposed averaged EPSC traces sampled before (1) and during (2) bath application of forskolin. B, activation of adenylyl cyclase abolishes LTD. Lower panel is a summary graph of the LTD induced in the absence (control, ○, n = 6) and continuous presence of forskolin (forskolin, 10 μm, □, n = 6). Inset illustrates superimposed EPSC traces taken before and after pairing at time points indicated by numbers in lower panel. C, the PKA inhibitor H89 reduces the amplitude of EPSCs. Lower panel illustrates a summary graph of the effect of H89 (10 μm) on the amplitude of EPSCs (n = 5). Inset illustrates averaged EPSC traces taken at time points indicated in lower panel. D, the PKA inhibitor H89 blocks LTD. Lower panel is a summary graph of LTD obtained in the absence (○, n = 8) and the continuous presence of H89 (10 μm, •, n = 5). Inset depicts EPSC traces from representative neurons collected at time points indicated by numbers in the lower panel. E, bath application of the cell permeant PKA inhibitor PKI (14–22) reduces the amplitude of EPSCs. Lower panel illustrates the effect of bath application of PKI (14–22) (3 μm) on the amplitude of EPSCs (n = 5). Inset represents superimposed averaged EPSC traces sampled before and during PKI (14–22) application. F, inhibition of presynaptic PKA abolishes LTD. Lower panel is a summary graph of LTD recorded in slices treated with the membrane permeant PKA inhibitor PKI (14–22) (▪, n = 7) or using an internal solution containing 1 μm of the membrane impermeant PKA inhibitor PKI (6–22) (n = 5). Note that pretreatment of slices with PKI (14–22) blocked LTD. In contrast, inhibition of the postsynaptic PKA with membrane impermeant PKI (6–22) had no significant effects on LTD induction (n = 5). Inset depicts EPSCs from representative neurons collected at time points indicated in lower panel. Calibration bars for the EPSC traces: 50 pA, 10 ms.

Similar articles

Cited by

References

    1. Bellone C, Lüscher C. mGluRs induce a long-term depression in the ventral tegmental area that involves a switch of the subunit composition of AMPA receptors. Eur J Neurosci. 2005;21:1280–1288. - PubMed
    1. Bisogno T, Howell F, Williams G, Minassi A, Cascio MG, Ligresti A, Matias I, Schiano-Moriello A, Paul P, Williams EJ, Gangadharan U, Hobbs C, Di Marzo V, Diherty P. Cloning of the first sn1-DGLs points to the spatial and temporal regulation of endocannabinoid signalling in the brain. J Cell Biol. 2003;163:463–468. - PMC - PubMed
    1. Chapin EM, Andrade R. A 5-HT7 receptor-mediated depolarization in the anterodorsal thalamus. II. Involvement of the hyperpolarization-activated current Ih. J Pharmacol Exp Ther. 2001;297:403–409. - PubMed
    1. Chavez-Noriega LE, Stevens CF. Increased transmitter release at excitatory synapses produced by direct activation of adenylate cyclase in rat hippocampal slices. J Neurosci. 1994;14:310–317. - PMC - PubMed
    1. Chevaleyre V, Castillo PE. Heterosynaptic LTD of hippocampal GABAergic synapses: a novel role of endocannabinoids in regulating excitability. Neuron. 2003;38:461–472. - PubMed

Publication types

MeSH terms

LinkOut - more resources